

 paper
paperInformation
- Publication Type: Master Thesis
- Workgroup(s)/Project(s):
- Date: July 2009
- TU Wien Library:
- Diploma Examination: 20. July 2009
- First Supervisor:

Abstract
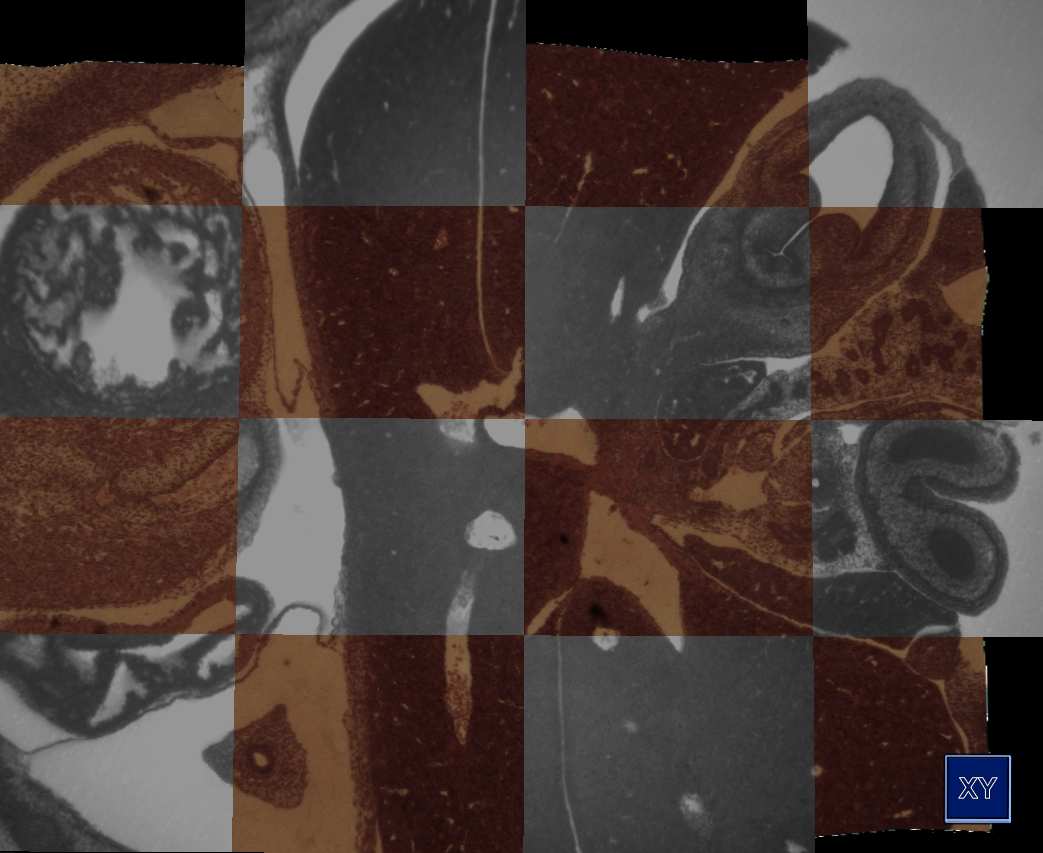
Weninger et al. [25] developed a novel methodology for rapid 2D and 3D computer analysis and visualization of gene expression patterns. The data is generated by staining a specimen followed by an iterating process of cutting thin slices and capturing them with an episcopic microscope. The result is an high resolution 3D dataset. One channel contains anatomical information and a second channel contains the gene expression patterns. In this thesis we examine methods for enhancing, registrating and visualizing this novel kind of data. We address the uneven illumination of slices that are introduced by the methodology. We developed an algorithm to fit a quadric surface through the background pixels to estimate the illumination situation over the whole slice. This estimate is used to correct the slices of one dataset. Further, an extension of this methodology was researched. Recycling the already cut sections for staining them a second time allows the medical domain scientists to augment their technique with additional information. The result of the second data generation phase is a stack of unaligned slices. The manual processing of the sections introduces non-linear deformations. We explored several registration algorithms to align the two image stacks. We found a two step registration approach to yield the best results. In the first step a coarse affine registration is used to approximately align the datasets. The result of the first step is inspected and if necessary corrected by the user. In the second step a b-spline registration is used that compensates for the non-linear deformations of the 2D slices. For the visual inspection of the registration results and to present an overview of the datasets we implemented two visualization approaches. A checkerboard view is used to compare 2D slices, and a three dimensional approach based on direct volume rendering incorporates surface enhancement by gradient magnitude opacity modulation to emphasize the alignment of tissue boundaries.Additional Files and Images

Weblinks
No further information available.BibTeX
@mastersthesis{brandorff-2009-erv,
  title =      "Enhancement, Registration, and Visualization of High
               Resolution Episcopic Microscopy Data",
  author =     "Clemens Brandorff",
  year =       "2009",
  abstract =   "Weninger et al. [25] developed a novel methodology for rapid
               2D and 3D computer analysis and visualization of gene
               expression patterns. The data is generated by staining a
               specimen followed by an iterating process of cutting thin
               slices and capturing them with an episcopic microscope. The
               result is an high resolution 3D dataset. One channel
               contains anatomical information and a second channel
               contains the gene expression patterns. In this thesis we
               examine methods for enhancing, registrating and visualizing
               this novel kind of data. We address the uneven illumination
               of slices that are introduced by the methodology. We
               developed an algorithm to fit a quadric surface through the
               background pixels to estimate the illumination situation
               over the whole slice. This estimate is used to correct the
               slices of one dataset. Further, an extension of this
               methodology was researched. Recycling the already cut
               sections for staining them a second time allows the medical
               domain scientists to augment their technique with additional
               information. The result of the second data generation phase
               is a stack of unaligned slices. The manual processing of the
               sections introduces non-linear deformations. We explored
               several registration algorithms to align the two image
               stacks. We found a two step registration approach to yield
               the best results. In the first step a coarse affine
               registration is used to approximately align the datasets.
               The result of the first step is inspected and if necessary
               corrected by the user. In the second step a b-spline
               registration is used that compensates for the non-linear
               deformations of the 2D slices. For the visual inspection of
               the registration results and to present an overview of the
               datasets we implemented two visualization approaches. A
               checkerboard view is used to compare 2D slices, and a three
               dimensional approach based on direct volume rendering
               incorporates surface enhancement by gradient magnitude
               opacity modulation to emphasize the alignment of tissue
               boundaries.",
  month =      jul,
  address =    "Favoritenstrasse 9-11/E193-02, A-1040 Vienna, Austria",
  school =     "Institute of Computer Graphics and Algorithms, Vienna
               University of Technology ",
  URL =        "https://www.cg.tuwien.ac.at/research/publications/2009/brandorff-2009-erv/",
}