Information
- Publication Type: Master Thesis
- Workgroup(s)/Project(s):
- Date: July 2009
- TU Wien Library:
- Diploma Examination: 20. July 2009
- First Supervisor:
Abstract
In this work, a framework for interactive visual analysis of attributed graphs has been
developed. An attributed graph is an extension of the standard graph of a binary
relation, which attaches a set of attributes to the nodes and edges. The implemented
visual analysis techniques aim at the local level at enabling an intuitive navigation in the
graph which reveals both the structure of the selected part of the graph and the
attributes of the nodes and edges in this part. At the global level these techniques aim at
understanding the distributions of the attributes in the graph as a whole or in specific
parts in it and at spotting meaningful associations between the attributes and the
relations.
The work presents several extensions to the attributes such as graph‐theoretic features,
values aggregated over the relations, and hierarchical grouping. All attributes are
treated in a unified manner which helps performing elaborate analysis tasks using the
existing tools.
Additionally, novel graph drawing techniques are proposed. They are designed to
understand attribute distributions and associations in the graph. These techniques can
be additionally used to visualize results of queries in the data, which can be also visually
defined using the attribute analysis tools.
Finally, the work addresses several types of association analysis in relational data, along
with visual analysis methods for them. It presents a perceptual enhancement for the
well‐known parallel sets technique for association analysis in categorical data, and
proposes extensions for employing it in relational data. Also, novels methods for other
types of association analysis are introduced.
The relational data in this work were defined upon typed events in an event‐based
system, which offers a flexible architecture for real‐time analysis. Nevertheless, the
presented analysis methods are generic and have been tested on two real‐world
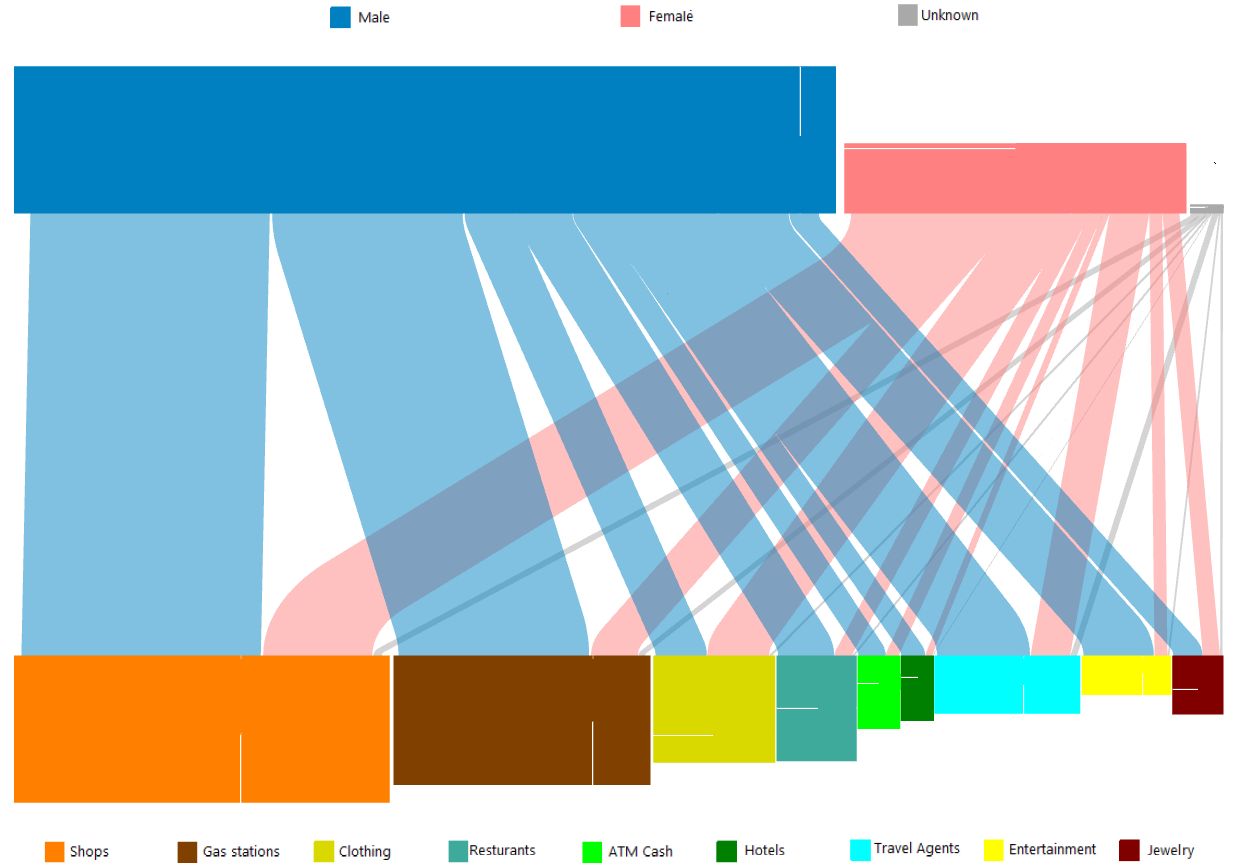
datasets. In the first dataset, entities for customers and products are derived from the
purchase events, and various meaningful associations were found between the attributes
and the relation (for example, which types of products the female customers bought
more frequently, or at which age customers have higher interest for books). In the
second dataset, events in an issue‐tracking system are analyzed to find out ticket
assignment patterns and forwarding patterns between the support offices.
Additional Files and Images
Additional images and videos
Additional files
Weblinks
No further information available.
BibTeX
@mastersthesis{alsallakh-2009-iva,
  title =      "Interactive Visual Analysis of Relational Data and
               Applications in Event-Based Business Analytics",
  author =     "Bilal Alsallakh",
  year =       "2009",
  abstract =   "In this work, a framework for interactive visual analysis of
               attributed graphs has been developed. An attributed graph is
               an extension of the standard graph of a binary relation,
               which attaches a set of attributes to the nodes and edges.
               The implemented visual analysis techniques aim at the local
               level at enabling an intuitive navigation in the graph which
               reveals both the structure of the selected part of the graph
               and the attributes of the nodes and edges in this part. At
               the global level these techniques aim at understanding the
               distributions of the attributes in the graph as a whole or
               in specific parts in it and at spotting meaningful
               associations between the attributes and the relations. The
               work presents several extensions to the attributes such as
               graph‐theoretic features, values aggregated over the
               relations, and hierarchical grouping. All attributes are
               treated in a unified manner which helps performing elaborate
               analysis tasks using the existing tools. Additionally, novel
               graph drawing techniques are proposed. They are designed to
               understand attribute distributions and associations in the
               graph. These techniques can be additionally used to
               visualize results of queries in the data, which can be also
               visually defined using the attribute analysis tools.
               Finally, the work addresses several types of association
               analysis in relational data, along with visual analysis
               methods for them. It presents a perceptual enhancement for
               the well‐known parallel sets technique for association
               analysis in categorical data, and proposes extensions for
               employing it in relational data. Also, novels methods for
               other types of association analysis are introduced. The
               relational data in this work were defined upon typed events
               in an event‐based system, which offers a flexible
               architecture for real‐time analysis. Nevertheless, the
               presented analysis methods are generic and have been tested
               on two real‐world datasets. In the first dataset, entities
               for customers and products are derived from the purchase
               events, and various meaningful associations were found
               between the attributes and the relation (for example, which
               types of products the female customers bought more
               frequently, or at which age customers have higher interest
               for books). In the second dataset, events in an
               issue‐tracking system are analyzed to find out ticket
               assignment patterns and forwarding patterns between the
               support offices.",
  month =      jul,
  address =    "Favoritenstrasse 9-11/E193-02, A-1040 Vienna, Austria",
  school =     "Institute of Computer Graphics and Algorithms, Vienna
               University of Technology ",
  URL =        "https://www.cg.tuwien.ac.at/research/publications/2009/alsallakh-2009-iva/",
}


 paper
paper
