

Florian Ladstädter, Andrea K. Steiner, Bettina C. Lackner, Gottfried Kirchengast, Philipp Muigg, Johannes Kehrer, Helmut Doleisch
SimVis: An Interactive Visual Field Exploration Tool Applied to Climate Research
In New Horizons in Occultation Research, pages 235-245, 2009
Information
- Visibility: hidden
- Publication Type: Article in a Book
- Workgroup(s)/Project(s):
- Date: 2009
- Booktitle: New Horizons in Occultation Research
- Publisher: Springer
- Pages: 235 – 245
Abstract
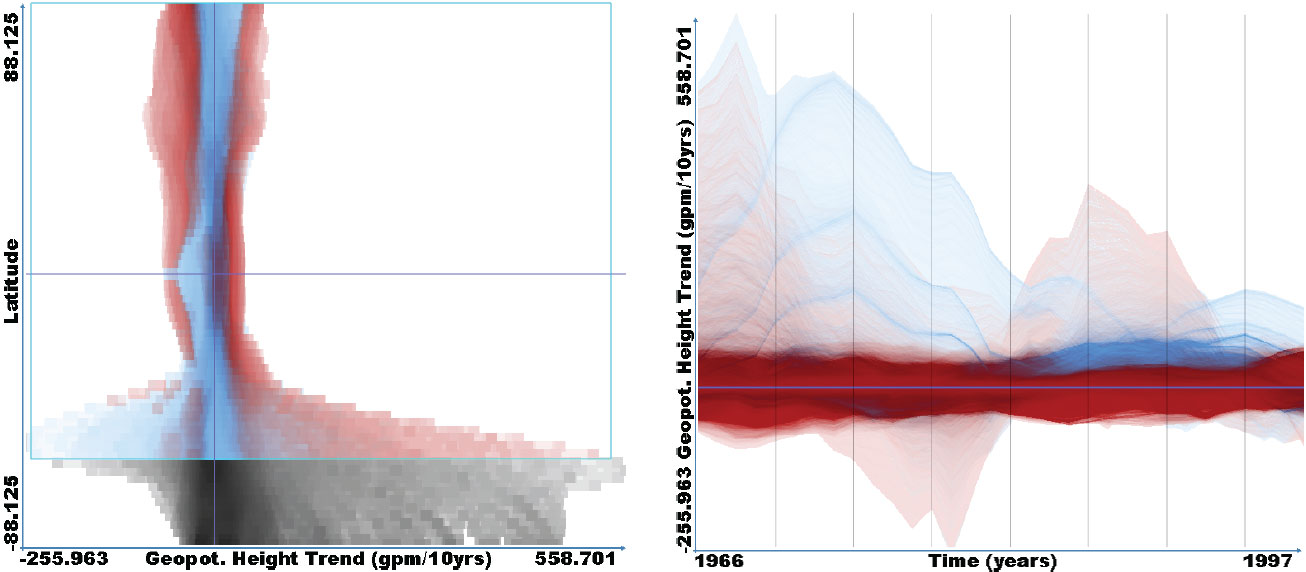
Climate research often deals with large multi-dimensional fields describing the state of the atmosphere. A novel approach to gain information about these large data sets has become feasible only recently using 4D visualization techniques. The Simulation Visualization (SimVis) software tool, developed by the VRVis Research Center (Vienna, Austria), uses such techniques to provide access to the data interactively and to explore and analyze large three-dimensional time-dependent fields. Non-trivial visualization approaches are applied to provide a responsive and useful interactive experience for the user. In this study we used SimVis for the investigation of climate research data sets. An ECHAM5 climate model run and the ERA-40 reanalysis data sets were explored, with the ultimate goal to identify parameters and regions reacting most sensitive to climate change, representing robust indicators. The focus lies on the upper troposphere-lower stratosphere (UTLS) region, in view of future applications of the findings to radio occultation (RO) climatologies. First results showing the capability of SimVis to deal with climate data, including trend time series and spatial distributions of RO parameters are presented.Additional Files and Images
Weblinks
No further information available.BibTeX
@incollection{Ladstaedter-2009-sim,
  title =      "SimVis: An Interactive Visual Field Exploration Tool Applied
               to Climate Research",
  author =     "Florian Ladst\"{a}dter and Andrea K. Steiner and Bettina C.
               Lackner and Gottfried Kirchengast and Philipp Muigg and
               Johannes Kehrer and Helmut Doleisch",
  year =       "2009",
  abstract =   "Climate research often deals with large multi-dimensional
               fields describing the state of the atmosphere. A novel
               approach to gain information about these large data sets has
               become feasible only recently using 4D visualization
               techniques. The Simulation Visualization (SimVis) software
               tool, developed by the VRVis Research Center (Vienna,
               Austria), uses such techniques to provide access to the data
               interactively and to explore and analyze large
               three-dimensional time-dependent fields. Non-trivial
               visualization approaches are applied to provide a responsive
               and useful interactive experience for the user. In this
               study we used SimVis for the investigation of climate
               research data sets. An ECHAM5 climate model run and the
               ERA-40 reanalysis data sets were explored, with the ultimate
               goal to identify parameters and regions reacting most
               sensitive to climate change, representing robust indicators.
               The focus lies on the upper troposphere-lower stratosphere
               (UTLS) region, in view of future applications of the
               findings to radio occultation (RO) climatologies. First
               results showing the capability of SimVis to deal with
               climate data, including trend time series and spatial
               distributions of RO parameters are presented.",
  booktitle =  "New Horizons in Occultation Research",
  publisher =  "Springer",
  URL =        "https://www.cg.tuwien.ac.at/research/publications/2009/Ladstaedter-2009-sim/",
}