

Wolfgang Freiler, Kresimir Matkovic , Helwig Hauser
Interactive Visual Analysis of Set-Typed Data
IEEE Transactions on Visualization and Computer Graphics, 14(6), November 2008. [image] [ paper]
Information
- Publication Type: Journal Paper with Conference Talk
- Workgroup(s)/Project(s):
- Date: November 2008
- Journal: IEEE Transactions on Visualization and Computer Graphics
- Volume: 14
- Number: 6
- Location: Columbus, Ohio
- Lecturer: Wolfgang Freiler
- Event: IEEE Info Vis
- Conference date: 19. October 2008 – 24. October 2008
- Keywords: Interactive Visual Analysis, Multiple Coordinated Views, Focus & Context, Categorical Data, Multidimensional Multivariate Data
Abstract
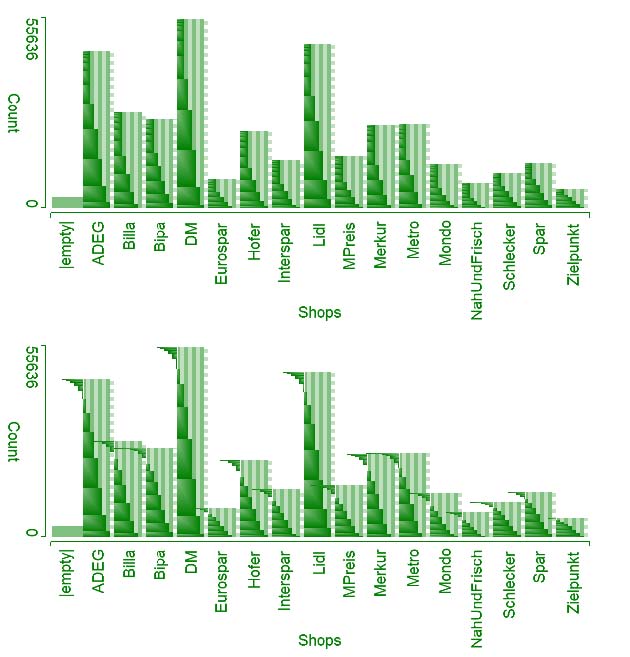
While it is quite typical to deal with attributes of different data types in the visualization of heterogeneous, multivariate datasets, most existing techniques still focus on the most usual data types such as numerical attributes or strings. In this paper we present a new approach to the interactive visual exploration and analysis of data that contains attributes which are of set type. A set-typed attribute of a data item – like one cell in a table – has a list of n ¸ 0 elements as a value. We present the set’o’gram as a visualization approach to represent data of set type and to enable interactive visual analysis. We also demonstrate how this approach is capable to help in dealing with datasets that have truly many dimensions (more than a dozen or more), especially in the context of categorical data. To illustrate the effectiveness of our approach, we present the interactive visual analysis of a CRM dataset with data from a questionnaire on the education and shopping habits of about 90000 people.Additional Files and Images

Weblinks
No further information available.BibTeX
@article{Freiler-2008-Set,
  title =      "Interactive Visual Analysis of Set-Typed Data",
  author =     "Wolfgang Freiler and Kresimir Matkovic and Helwig Hauser",
  year =       "2008",
  abstract =   "While it is quite typical to deal with attributes of
               different data types in the visualization of heterogeneous,
               multivariate datasets, most existing techniques still focus
               on the most usual data types such as numerical attributes or
               strings. In this paper we present a new approach to the
               interactive visual exploration and analysis of data that
               contains attributes which are of set type. A set-typed
               attribute of a data item – like one cell in a table –
               has a list of n ¸ 0 elements as a value. We present the
               set’o’gram as a visualization approach to represent data
               of set type and to enable interactive visual analysis. We
               also demonstrate how this approach is capable to help in
               dealing with datasets that have truly many dimensions (more
               than a dozen or more), especially in the context of
               categorical data. To illustrate the effectiveness of our
               approach, we present the interactive visual analysis of a
               CRM dataset with data from a questionnaire on the education
               and shopping habits of about 90000 people.",
  month =      nov,
  journal =    "IEEE Transactions on Visualization and Computer Graphics",
  volume =     "14",
  number =     "6",
  keywords =   "Interactive Visual Analysis,  Multiple Coordinated Views,
               Focus & Context, Categorical Data, Multidimensional
               Multivariate Data",
  URL =        "https://www.cg.tuwien.ac.at/research/publications/2008/Freiler-2008-Set/",
}