

Kresimir Matkovic , Denis Gracanin, Zoltan Konyha, Helwig Hauser
Color Lines View: An Approach to Visualization of Families of Function Graphs
In Proceedings of 11th International Conference Information Visualization. July 2007.
[] [ paper]
Information
- Publication Type: Conference Paper
- Workgroup(s)/Project(s):
- Date: July 2007
- Location: Zürich, Schweiz
- Lecturer: Zoltan Konyha
- Booktitle: Proceedings of 11th International Conference Information Visualization
- Conference date: 2. July 2007 – 6. July 2007
Abstract
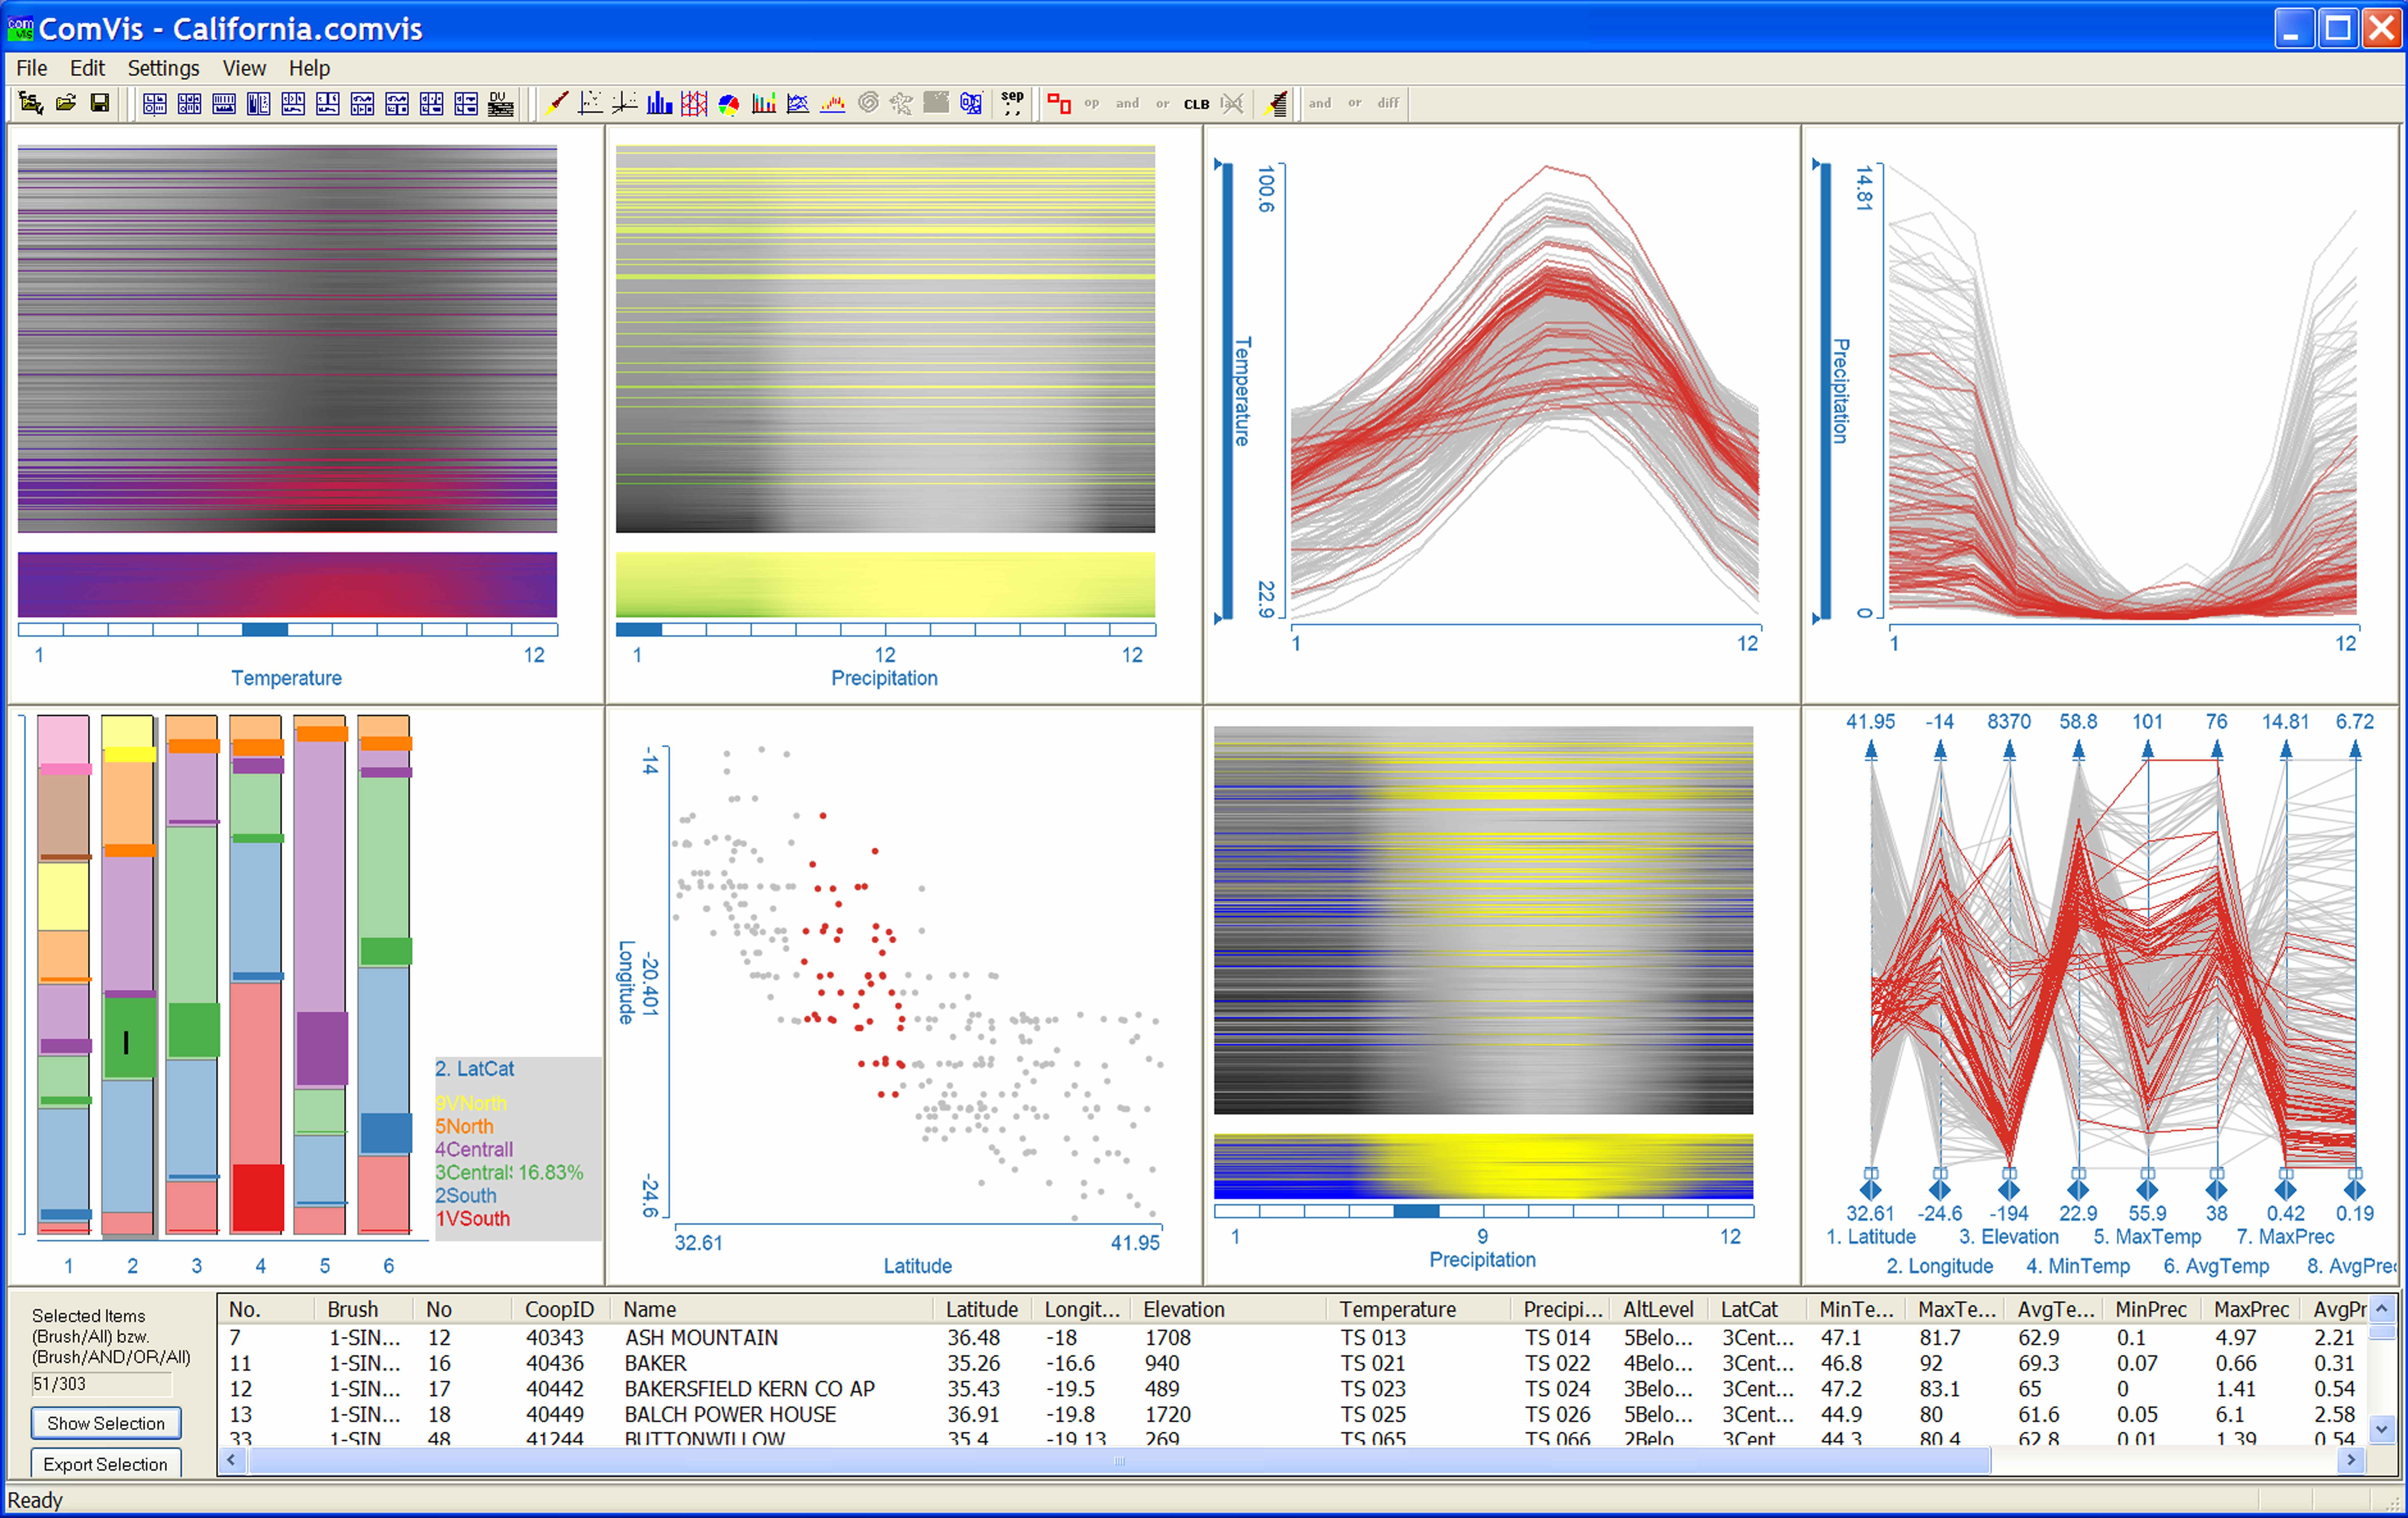
Data sets often include information that can be represented as a mapping that describes how a dependent variable depends on an independent variable. Such a mapping, usually represented as a function graph, can be parameterized to provide a family of function graphs. The challenge is how to efficiently aggregate individual function graph views to represent the whole family and allow visual analysis and search for patterns. We propose a novel view, called the color lines view, which provides a two dimensional, rectangular view where each line represents a single function graph. The points on the line correspond to values of the independent variable. The point colors represent the value of the dependent variable. The lines, placed next to each other in parallel, show a family of function graphs. The color lines view offers sorting and brushing features which support visual analysis procedures that are difficult to perform with previously existing views.Additional Files and Images

Weblinks
No further information available.BibTeX
@inproceedings{matkovic-2007-clv,
  title =      "Color Lines View: An Approach to Visualization of Families
               of Function Graphs",
  author =     "Kresimir Matkovic and Denis Gracanin and Zoltan Konyha and
               Helwig Hauser",
  year =       "2007",
  abstract =   "Data sets often include information that can be represented
               as a mapping that describes how a dependent variable depends
               on an independent variable. Such a mapping, usually
               represented as a function graph, can be parameterized to
               provide a family of function graphs. The challenge is how to
               efficiently aggregate individual function graph views to
               represent the whole family and allow visual analysis and
               search for patterns. We propose a novel view, called the
               color lines view, which provides a two dimensional,
               rectangular view where each line represents a single
               function graph. The points on the line correspond to values
               of the independent variable. The point colors represent the
               value of the dependent variable. The lines, placed next to
               each other in parallel, show a family of function graphs.
               The color lines view offers sorting and brushing features
               which support visual analysis procedures that are difficult
               to perform with previously existing views.",
  month =      jul,
  location =   "Z\"{u}rich, Schweiz",
  booktitle =  "Proceedings of 11th International Conference Information
               Visualization",
  URL =        "https://www.cg.tuwien.ac.at/research/publications/2007/matkovic-2007-clv/",
}