

Peter Rautek , Alexander Reiterer, Eduard Gröller
Caricaturistic Visualization of Deformation Data Based on High Density Point Clouds
Poster shown at
( 9. July 2007-12. July 2007)
In 8th Conference on Optical 3-D Measurement Techniques, Zurich, Switzerland
.
Information
- Publication Type: Poster
- Workgroup(s)/Project(s):
- Date: 2007
- Booktitle: 8th Conference on Optical 3-D Measurement Techniques, Zurich, Switzerland
- Conference date: 9. July 2007 – 12. July 2007
- Keywords: Point Cloud, Deformation Measurement, Visualization
Abstract
Modern deformation monitoring techniques offer possibilities to measure and analyze deformation processes in detail. There are various different sensor systems on the market that can be used in these application fields, each having specific features in terms of accuracy, robustness, user interaction, operational range, measurement speed and frequency, resolution, or other relevant parameters. The selection of an appropriate sensor system for a particular application is not trivial.In recent years research on image-based measurement systems and laser scanners has gained increasing interest – in many cases a combination of different sensors has advantages over a single-sensor system (e.g. different accuracy and reliability classes, different measurement range, etc.).
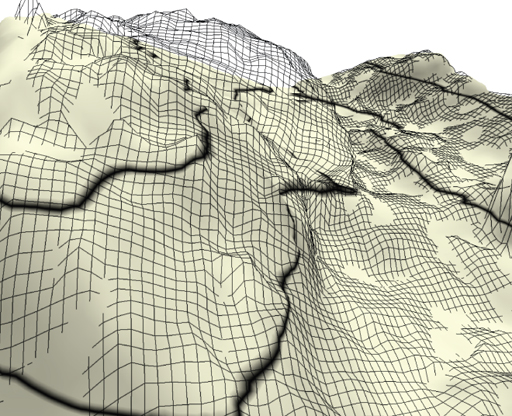
The point clouds produced by such systems potentially consist of a vast number of points. One of the main problems concerning the analysis and interpretation of deformation measurements is the visualization of the data respectively of the underlying deformation. In this paper we present the application of the recently developed caricaturistic visualization method to deformation data based on high density point clouds. Caricaturistic visualization depicts the deformation data in an exaggerated way. The exaggeration of the deformation accents subtle deviations and supports the viewer for the correct interpretation of the underlying deformation. We show results for facade deformation data as well as for landslide data.
Additional Files and Images

Weblinks
No further information available.BibTeX
@misc{Rautek-2007-O3D,
  title =      "Caricaturistic Visualization of Deformation Data Based on
               High Density Point Clouds",
  author =     "Peter Rautek and Alexander Reiterer and Eduard Gr\"{o}ller",
  year =       "2007",
  abstract =   "Modern deformation monitoring techniques offer possibilities
               to measure and analyze deformation processes in detail.
               There are various different sensor systems on the market
               that can be used in these application fields, each having
               specific features in terms of accuracy, robustness, user
               interaction, operational range, measurement speed and
               frequency, resolution, or other relevant parameters. The
               selection of an appropriate sensor system for a particular
               application is not trivial.  In recent years research on
               image-based measurement systems and laser scanners has
               gained increasing interest – in many cases a combination
               of different sensors has advantages over a single-sensor
               system (e.g. different accuracy and reliability classes,
               different measurement range, etc.).  The point clouds
               produced by such systems potentially consist of a vast
               number of points. One of the main problems concerning the
               analysis and interpretation of deformation measurements is
               the visualization of the data respectively of the underlying
               deformation. In this paper we present the application of the
               recently developed caricaturistic visualization method to
               deformation data based on high density point clouds.
               Caricaturistic visualization depicts the deformation data in
               an exaggerated way. The exaggeration of the deformation
               accents subtle deviations and supports the viewer for the
               correct interpretation of the underlying deformation. We
               show results for facade deformation data as well as for
               landslide data. ",
  booktitle =  "8th Conference on Optical 3-D Measurement Techniques,
               Zurich, Switzerland",
  Conference date = "Poster presented at  (2007-07-09--2007-07-12)",
  keywords =   "Point Cloud, Deformation Measurement, Visualization",
  URL =        "https://www.cg.tuwien.ac.at/research/publications/2007/Rautek-2007-O3D/",
}