

Georg Zotti
A Sky Dome Visualisation for Identification of Astronomical Orientations
Information Visualization, 2006(5):152-166, 2006. [Steinabrunn Stone Age Sky]
Information
- Publication Type: Journal Paper (without talk)
- Workgroup(s)/Project(s):
- Date: 2006
- ISSN: 1473-8716
- Journal: Information Visualization
- Number: 5
- Volume: 2006
- Pages: 152 – 166
- Keywords: data mining, astronomy, archaeology
Abstract
It has long been known that ancient temples were frequently oriented along the cardinal directions or to certain points along the horizon where the Sun or the Moon rises or sets on special days of the year. In the last decades, archaeologists have found evidence of even older building structures buried in the soil, with doorways that also appear to have distinct orientations.This paper presents a novel diagram combining archaeological maps with a folded-apart, flattened view of the whole sky, showing the local horizon and the daily paths of the Sun, Moon and brighter stars. By use of this diagram, interesting groupings of astronomical orientation directions, e.g. to certain sunrise and sunset points could be identified, which were evidently used to mark certain days of the year. Orientations towards rising and setting points of a few significant stars very likely indicated the beginning of the agricultural year in the middle neolithic period.
Additional Files and Images
Additional images and videos
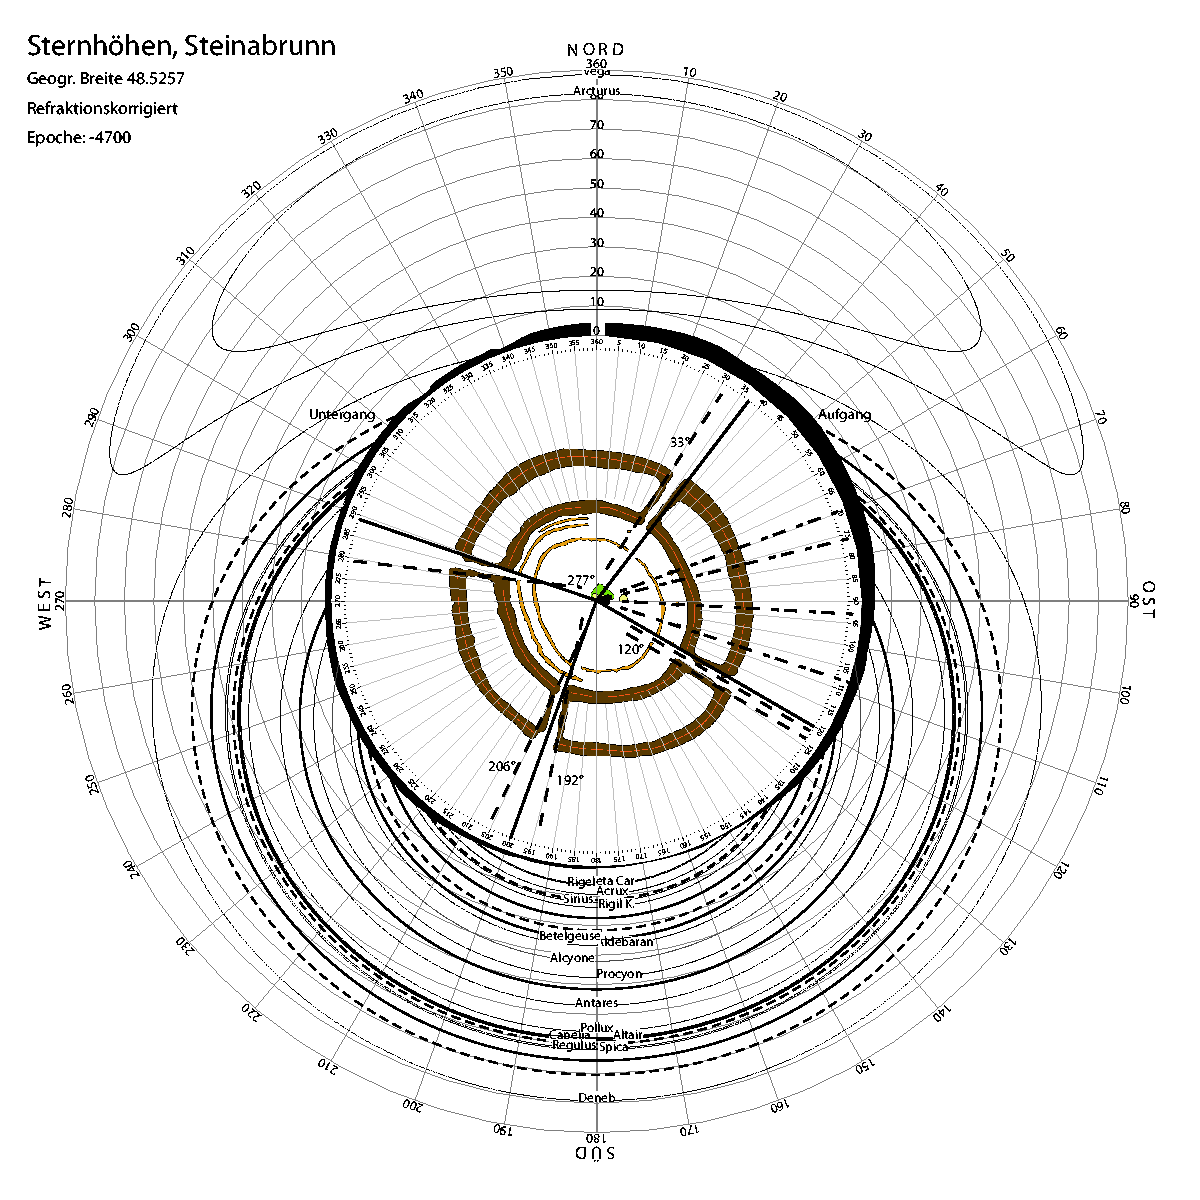
Steinabrunn Stone Age Sky:
This diagram combines an archaeological map (center) with horizon data (black irregular ring) and sky data for the archaeological site. Possible astronomical alignments can immediately be recognized.
Additional files

Weblinks
No further information available.BibTeX
@article{zotti-2006-dgm,
  title =      "A Sky Dome Visualisation for Identification of Astronomical
               Orientations",
  author =     "Georg Zotti",
  year =       "2006",
  abstract =   "It has long been known that ancient temples were frequently
               oriented   along the cardinal directions or to certain
               points along the horizon   where the Sun or the Moon rises
               or sets on special days of the year.  In the   last decades,
               archaeologists have found evidence of even older   building
               structures buried in the soil, with doorways that also
               appear to have distinct orientations.    This paper presents
               a novel diagram combining archaeological maps   with a
               folded-apart, flattened view of the whole sky, showing the
               local horizon and the daily paths of the Sun, Moon and
               brighter stars.   By use of this diagram, interesting
               groupings of astronomical   orientation directions, e.g. to
               certain sunrise and sunset points   could be identified,
               which were evidently used to mark certain days   of the
               year. Orientations towards rising and setting points of a
               few   significant stars very likely indicated the beginning
               of the   agricultural year in the middle neolithic period.",
  issn =       "1473-8716",
  journal =    "Information Visualization",
  number =     "5",
  volume =     "2006",
  pages =      "152--166",
  keywords =   "data mining, astronomy, archaeology",
  URL =        "https://www.cg.tuwien.ac.at/research/publications/2006/zotti-2006-dgm/",
}