

Peter Rautek
Caricaturistic Visualization,
19. July 2006-21. July 2006, Rügen, Germany
[![]() Presentation]
Presentation]
Information
- Publication Type: Invited Talk
- Workgroup(s)/Project(s):
- Date: 2006
- Event: Workshop on Visualization in Medicine and Life Sciences
- Location: Rügen, Germany
- Conference date: 19. July 2006 – 21. July 2006
Abstract
For many applications of medicine and life science, data is gathered or measured to find and to analyze the characteristics of the investigated object. Characteristics of a dataset can be expressed as the deviations from the norm. These deviations traditionally are found and classified using statistical methods. In many cases the statistical models do not appropriately describe the underlying phenomenon. They are therefore unsuitable for the data of interest. In this case visualization can replace the statistical methods. Expressive visualizations guide the user to find characteristics. Further the user is enabled to analyze the deviations of a given dataset. Caricaturistic visualization is an expressive method tailored to depict the deviations in an exaggerated way. It is guided by the idea of caricatures which exaggerate the outstanding features of an object. A method for caricaturistic visualization is presented and its power is shown on different examples. Caricaturistic visualization assumes the existence of a reference model. In many applications an explicit reference model is not available. To overcome this limitation different datasets are compared to each other. This results in the Caricature matrix, a 2D matrix of caricaturistic visualizations.Additional Files and Images
Additional images and videos
image:
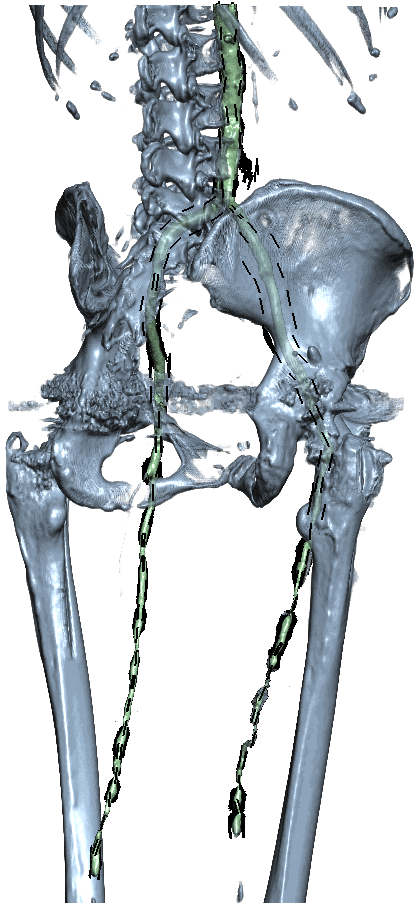
Caricaturistic Vessel Visualization
Additional files
Weblinks
No further information available.BibTeX
@talk{Rautek06VMLS,
  title =      "Caricaturistic Visualization",
  author =     "Peter Rautek",
  year =       "2006",
  abstract =   "For many applications of medicine and life science, data is
               gathered or measured to find and to analyze the
               characteristics of the investigated object. Characteristics
               of a dataset can be expressed as the deviations from the
               norm. These deviations traditionally are found and
               classified using statistical methods. In many cases the
               statistical models do not appropriately describe the
               underlying phenomenon. They are therefore unsuitable for the
               data of interest. In this case visualization can replace the
               statistical methods. Expressive visualizations guide the
               user to find characteristics. Further the user is enabled to
               analyze the deviations of a given dataset. Caricaturistic
               visualization is an expressive method tailored to depict the
               deviations in an exaggerated way. It is guided by the idea
               of caricatures which exaggerate the outstanding features of
               an object. A method for caricaturistic visualization is
               presented and its power is shown on different examples.
               Caricaturistic visualization assumes the existence of a
               reference model. In many applications an explicit reference
               model is not available. To overcome this limitation
               different datasets are compared to each other. This results
               in the Caricature matrix, a 2D matrix of caricaturistic
               visualizations. ",
  event =      "Workshop on Visualization in Medicine and Life Sciences",
  location =   "R\"{u}gen, Germany",
  URL =        "https://www.cg.tuwien.ac.at/research/publications/2006/Rautek06VMLS/",
}