

Matej Mlejnek
Medical Visualization for Orthopedic Applications
Supervisor: Eduard Gröller
Duration: 2003 — 2006
[ pdf]
pdf]
Information
- Publication Type: PhD-Thesis
- Workgroup(s)/Project(s):
- Date: 2006
- Date (Start): 2003
- Date (End): 2006
- TU Wien Library:
- First Supervisor: Eduard Gröller
- Keywords: applications of visualization, visualization in medicine
Abstract
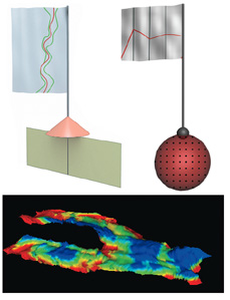
This dissertation discusses visualization techniques of articular cartilage for both quantitative and qualitative assessment. Articular cartilage is a very thin structure covering the endings of human bones. Thus, even slight changes in its thickness and inner structure may indicate an occurrence or progress of degeneration. The early detection of these factors is crucial for diagnosis and treatment of cartilage degeneration. Research to find treatments to stop or even reverse these degenerative changes is well in progress. Magnetic resonance imaging is currently the best and most used non-invasive technique for acquisition of soft tissue structures like articular cartilage. In this work we use two types of data: a high-resolution anatomical scan of the cartilage and a T2 map, which is computed from a set of sequences with varying parameters. While the thickness of the data can be precisely assessed fromthe anatomical scan, the T2 map offers information on the inner structures of the cartilage. Since the femoral cartilage is a curved thin-wall structure with a relatively small extent in one direction, it is very difficult to estimate its thickness from a stack of slices or even from a three-dimensional reconstruction of its surface. We discuss inspection of the tissue by unfolding and, thus, representing the tissue as a two-dimensional height field. Such a transformation of the object enables the application of 2D geometrical operations in order to observe subtle details in the thickness of the tissue. Nowadays scanners allow a quality assessment checking disruptions in the pattern of the T2 map of the patellar cartilage. The T2 map illustrates the quality of the cartilage and changes in the pattern of T2 map indicate defects before changes in the thickness itself occur. We propose the Profile Flags - an intuitive interface for probing of the T2 maps by browsing the reconstructed surface of the cartilage. The Profile Flag is positioned on the reconstructed surface of the tissue, and can be moved along it. The Profile Flags can be applied to annotate local as well as global characteristics of the underlying data in a single still image. Furthermore, we present a set of extensions to Profile Flags for selection, classification and automatic positioning. Profile Flags can also be used to measure time-varying dynamic contrast enhanced magnetic resonance imaging data.Additional Files and Images

Weblinks
No further information available.BibTeX
@phdthesis{Mlejnek_2006_MVOA,
  title =      "Medical Visualization for Orthopedic Applications",
  author =     "Matej Mlejnek",
  year =       "2006",
  abstract =   "This dissertation discusses visualization techniques of
               articular cartilage for both quantitative and qualitative
               assessment. Articular cartilage is a very thin structure
               covering the endings of human bones. Thus, even slight
               changes in its thickness and inner structure may indicate an
               occurrence or progress of degeneration. The early detection
               of these factors is crucial for diagnosis and treatment of
               cartilage degeneration. Research to find treatments to stop
               or even reverse these degenerative changes is well in
               progress. Magnetic resonance imaging is currently the best
               and most used non-invasive technique for acquisition of soft
               tissue structures like articular cartilage. In this work we
               use two types of data: a high-resolution anatomical scan of
               the cartilage and a T2 map, which is computed from a set of
               sequences with varying parameters. While the thickness of
               the data can be precisely assessed fromthe anatomical scan,
               the T2 map offers information on the inner structures of the
               cartilage. Since the femoral cartilage is a curved thin-wall
               structure with a relatively small extent in one direction,
               it is very difficult to estimate its thickness from a stack
               of slices or even from a three-dimensional reconstruction of
               its surface. We discuss inspection of the tissue by
               unfolding and, thus, representing the tissue as a
               two-dimensional height field. Such a transformation of the
               object enables the application of 2D geometrical operations
               in order to observe subtle details in the thickness of the
               tissue. Nowadays scanners allow a quality assessment
               checking disruptions in the pattern of the T2 map of the
               patellar cartilage. The T2 map illustrates the quality of
               the cartilage and changes in the pattern of T2 map indicate
               defects before changes in the thickness itself occur. We
               propose the Profile Flags - an intuitive interface for
               probing of the T2 maps by browsing the reconstructed surface
               of the cartilage. The Profile Flag is positioned on the
               reconstructed surface of the tissue, and can be moved along
               it. The Profile Flags can be applied to annotate local as
               well as global characteristics of the underlying data in a
               single still image. Furthermore, we present a set of
               extensions to Profile Flags for selection, classification
               and automatic positioning. Profile Flags can also be used to
               measure time-varying dynamic contrast enhanced magnetic
               resonance imaging data.",
  address =    "Favoritenstrasse 9-11/E193-02, A-1040 Vienna, Austria",
  school =     "Institute of Computer Graphics and Algorithms, Vienna
               University of Technology ",
  keywords =   "applications of visualization, visualization in medicine",
  URL =        "https://www.cg.tuwien.ac.at/research/publications/2006/Mlejnek_2006_MVOA/",
}