

Matej Mlejnek, Pierre Ermes, Anna Vilanova i Bartroli , Rob van der Rijt, Harrie van den Bosch, Frans Gerritsen, Eduard Gröller
Profile Flags: a Novel Metaphor for Probing of T2 Maps
In Proceedings of IEEE Visualization 2005, pages 599-606. October 2005.
[ paper] [
![]() soundtrack]
soundtrack]
Information
- Publication Type: Conference Paper
- Workgroup(s)/Project(s):
- Date: October 2005
- ISBN: 0780394623
- Publisher: IEEE CS
- Location: Minneapolis, USA
- Lecturer: Matej Mlejnek
- Editor: C. T. Silva, E. Gröller, H. Rushmeier
- Booktitle: Proceedings of IEEE Visualization 2005
- Conference date: 23. October 2005 – 28. October 2005
- Pages: 599 – 606
- Keywords: applications of visualization, visualization in medicine
Abstract
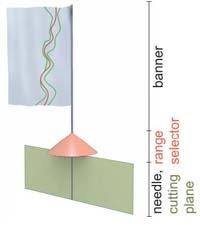
This paper describes a tool for the visualization of T2 maps of knee cartilage. Given the anatomical scan and the T2 map of the cartilage, we combine the information on the shape and the quality of the cartilage in a single image. The Profile Flag is an intuitive 3D glyph for probing and annotating of the underlying data. It comprises a bulletin board pin-like shape with a small flag on top of it. While moving the glyph along the reconstructed surface of an object, the curve data measured along the pin's needle and in its neighborhood are shown on the flag. The application area of the Profile Flag is manifold, enabling the visualization of profile data of dense but inhomogeneous objects. Furthermore, it extracts the essential part of the data without removing or even reducing the context information. By sticking Profile Flags into the investigated structure, one or more significant locations can be annotated by showing the local characteristics of the data at that locations. In this paper we are demonstrating the properties of the tool by visualizing T2 maps of knee cartilage.Additional Files and Images

Weblinks
No further information available.BibTeX
@inproceedings{Mlejnek_2004_PF,
  title =      "Profile Flags: a Novel Metaphor for Probing of T2 Maps",
  author =     "Matej Mlejnek and Pierre Ermes and Anna Vilanova i Bartroli
               and Rob van der Rijt and Harrie van den Bosch and Frans
               Gerritsen and Eduard Gr\"{o}ller",
  year =       "2005",
  abstract =   "This paper describes a tool for the visualization of T2 maps
               of knee cartilage. Given the anatomical scan and the T2 map
               of the cartilage, we combine the information on the shape
               and the quality of the cartilage in a single image. The
               Profile Flag is an intuitive 3D glyph for probing and
               annotating of the underlying data. It comprises a bulletin
               board pin-like shape with a small flag on top of it. While
               moving the glyph along the reconstructed surface of an
               object, the curve data measured along the pin's needle and
               in its neighborhood are shown on the flag. The application
               area of the Profile Flag is manifold, enabling the
               visualization of profile data of dense but inhomogeneous
               objects. Furthermore, it extracts the essential part of the
               data without removing or even reducing the context
               information. By sticking Profile Flags into the investigated
               structure, one or more significant locations can be
               annotated by showing the local characteristics of the data
               at that locations. In this paper we are demonstrating the
               properties of the tool by visualizing T2 maps of knee
               cartilage.",
  month =      oct,
  isbn =       "0780394623",
  publisher =  "IEEE CS",
  location =   "Minneapolis, USA",
  editor =     "C. T. Silva, E. Gr\"{o}ller, H. Rushmeier",
  booktitle =  "Proceedings of IEEE Visualization 2005",
  pages =      "599--606",
  keywords =   "applications of visualization, visualization in medicine",
  URL =        "https://www.cg.tuwien.ac.at/research/publications/2005/Mlejnek_2004_PF/",
}