User Guide
Graph Viewer
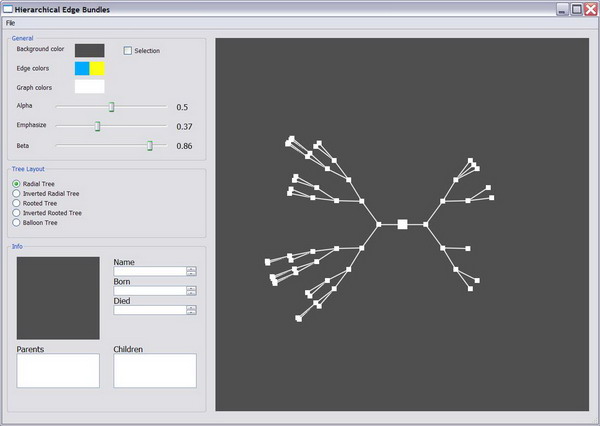
After startup the application provides the user with the graph viewer interface and control panel with several controls and slides.
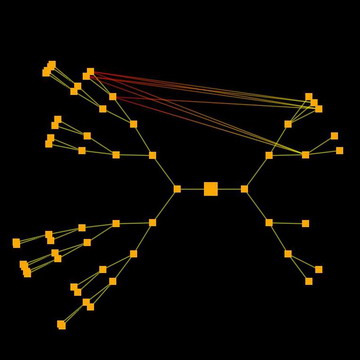
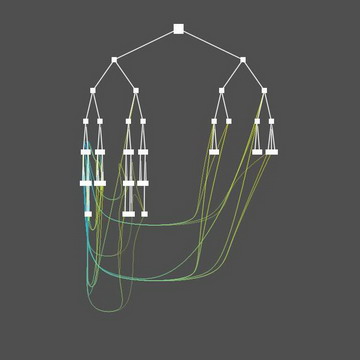
The first step will be to load a dataset, which is simply done by clicking on File -> Load New Data. In the file dialog, we choose a .tree dataset to load. After this, a graph is automatically drawn in the Graph Viewer.
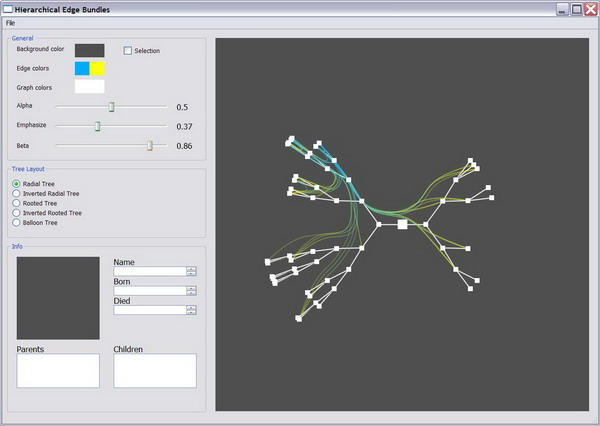
Loading additional edges is then done by clicking on File -> Load Relations. Splines are drawn on the graph according to the relations specified in the .rel file.
Of course zooming and panning of the graph is possible. To Zoom press the right mouse button and drag the mouse downward to zoom out and to the right or left to zoom in.
To Pan/Move press the middle mouse button and move the mouse in the direction you wish to move the graph.
Control panel
The General box on the control panel contains simple controls considering the look and style of the visualization.
Here, the Background color, the Edge colors, and the Graph colors can be changed by clicking on the colored rectangles and choosing a new color from a color palette.
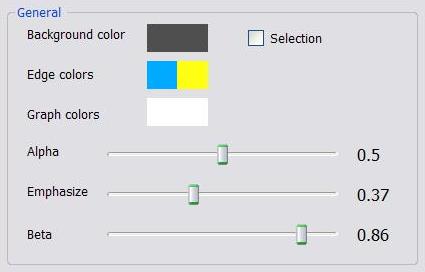
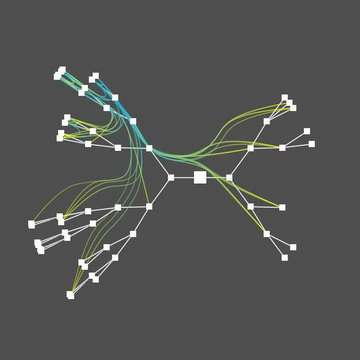
By changing the Alpha slider, the curves become more or less visible (until some of them disappear).
The Emphasize slider controls the amount of the emphasis of the short curves. When the value is high, curves with many control points become less visible and short curves are emphasized stronger.
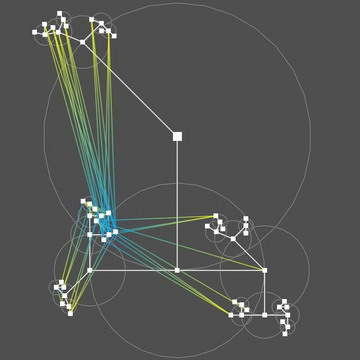
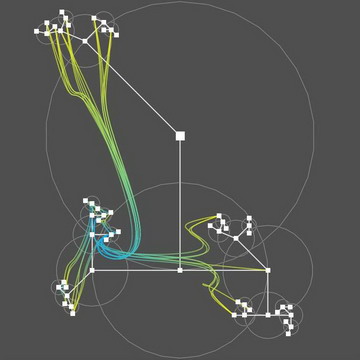
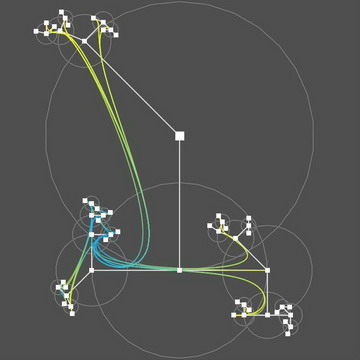
The Beta slider controls the amount of straightening of the curve.
In the following pictures beta is 0, 0.7 and 1.0.
Selection
To inspect a single bundle, you can select it by ticking on the Selection box and then pressing the CTRL-key and when a cursor appears on the mouse you can click into the graph and draw a line. This line defines the selection. You can see which curves are selected interactively. All the other curves dissapear. You can further inspect the currently selected lines by e.g. setting the Beta parameter to 0 as shown in the following example.
Graph Layouts
There are several graph layouts implemented to view the hierarchical tree structure:
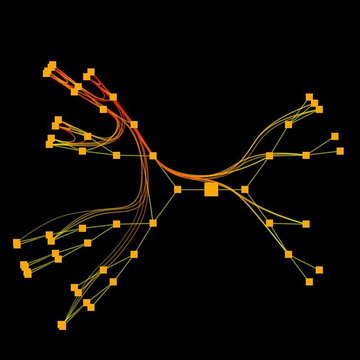
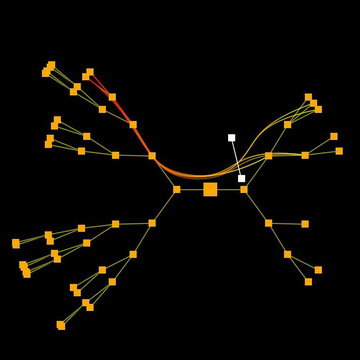
- Radial tree
- Inverted radial tree
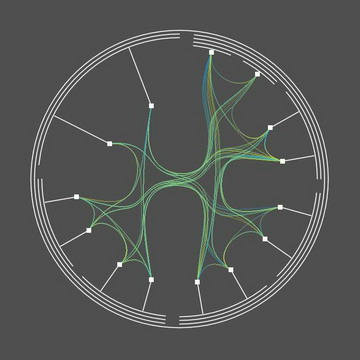
- Rooted tree
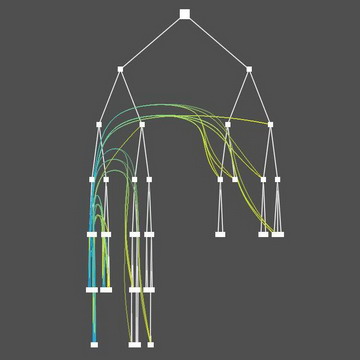
- Inverted rooted tree
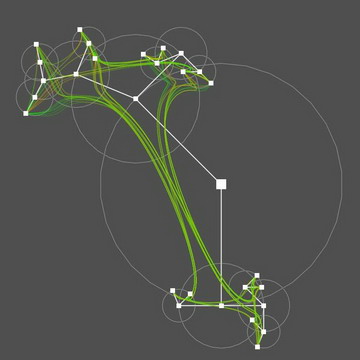
- Balloon tree
Data Inspection
Further, the nodes of the dataset can be inspected. When clicking on a node with the left mouse button and holding SHIFT-key, the information about the node is shown in the inspection fields at the left of the viewer.
