Motivation
There is a large class of data sets that contain both hierarchical components, i.e., parent-child relations between data items, as well as non-hierarchical components representing additional relations between data items. To gain more insight in the hierarchical organization of these datasets, we can visualize the hierarchical structure using one of the many tree visualization methods that have been proposed in the past. However, if we want to visualize additional adjacency edges on top of this by adding edges in a straightforward way, this generally leads to visual clutter.
Hence we followed the paper by Dany Holten [1] and constructed a generic technique for the visualization of hierarchical graphs with additional (directed) adjacency edges. It is called "hierarchical edge bundles".
Hierarchical edge bundling is based on the principle of visually bundling adjacency edges together analogous to the way electrical wires and network cables are merged into bundles along their joint paths and fanned out again at the end, in order to make an otherwise tangled web of wires and cables more manageable.
- Hierarchical edge bundling is a flexible and generic method that can be used in conjunction with existing tree visualization techniques.
- Hierarchical edge bundling reduces visual clutter when dealing with large numbers of adjacency edges.
- Hierarchical edge bundling provides an intuitive and continuous way to control the strength of bundling.
Principle
Since hierarchical edge bundling has to be usable in conjunction with existing tree visualization techniques, it proposes to use the layout provided by a tree visualization as a guide for bundling the adjacency edges. The approach is to use the path along the hierarchy between two nodes having an adjacency relation as the control polygon of a spline curve; the resulting curve is subsequently used to visualize the relation.
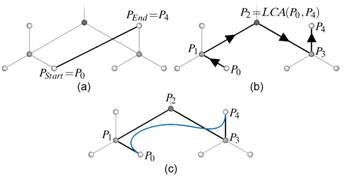
If this approach is used directly for bundling adjacency edges, ambiguity problems may arise. These problems can be reduced by diminishing the bundling strength. The bundling strength is controlled by a parameter, beta [0,1], that effectively controls the amount of bundling by straightening the spline curve.
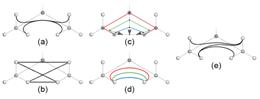
In addition several other rules are applied to enhance the visualization, such as removal of certain control points to reduce overlap and ambiguity problems.
Rendering
An important aspect of visualizing the curves is the way how they are drawn. Techniques like alpha blending are used to further emphasize short curves by drawing long curves at a lower opacity than short curves or to more easily discern individual curves or subbundles within a bundle�other techniques can also be used.
To vizualize the direction of the adjacency edges they are colored in two different colors, one indication the source and the other one the destination. The colors along the curve are interpolated.
For further details refer to [1].