Development
The most challenging aspect of the Multi-Scale implementation has been the integration into TIS as a graphics operator. As of June 2008, it is the first graphics operator done by an external developer outside of XIMES. To make external graphics operators possible, a new interface has been integrated into TIS called the ChartLibrary.
The rendering is done using the Graphicsserver by Pinnacle WebWorkz which is also used by other graphics operators of TIS. However, the Multi-Scale operator is more complex and therefore has to use annotations for secondary scales and draw the grid itself using a post-rendering event.
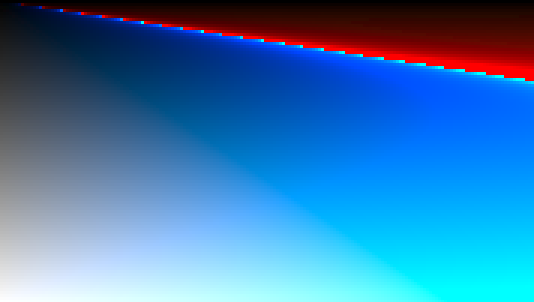 Another challenge has been the implementation of the CIELUV color space. Some source values result
in RGB values outside the range of RGB values that can be displayed by a typical computer screen. It is not
possible to map RGB values outside of the range [0,255] to 0 or 255 in order to get sensible values because
there might be unexpected
and very bad results. The example to the right shows what would happen for a cyan hue,
mapping the chroma on the horizontal axis and the lightness on the vertical axis.
It is therefore necessary to move from an illegal value to the next legal value in the HCL
color space. This is done by a lookup table in order to speed up the code.
Another challenge has been the implementation of the CIELUV color space. Some source values result
in RGB values outside the range of RGB values that can be displayed by a typical computer screen. It is not
possible to map RGB values outside of the range [0,255] to 0 or 255 in order to get sensible values because
there might be unexpected
and very bad results. The example to the right shows what would happen for a cyan hue,
mapping the chroma on the horizontal axis and the lightness on the vertical axis.
It is therefore necessary to move from an illegal value to the next legal value in the HCL
color space. This is done by a lookup table in order to speed up the code.
Currently, the Mult-Scale visualization is in a usable beta state. It will run stable on the next TIS release, but not part of it yet. Further features will be added. Among other things, a user study done by the Department for Knowledge and Communication Management at Danube University Krems will be incorporated.