

by Matúš Straka, Michal Cervenansky Alexandra La Cruz, Arnold Köchl, Miloš Šrámek, Eduard Gröller, Dominik Fleischmann
Abstract
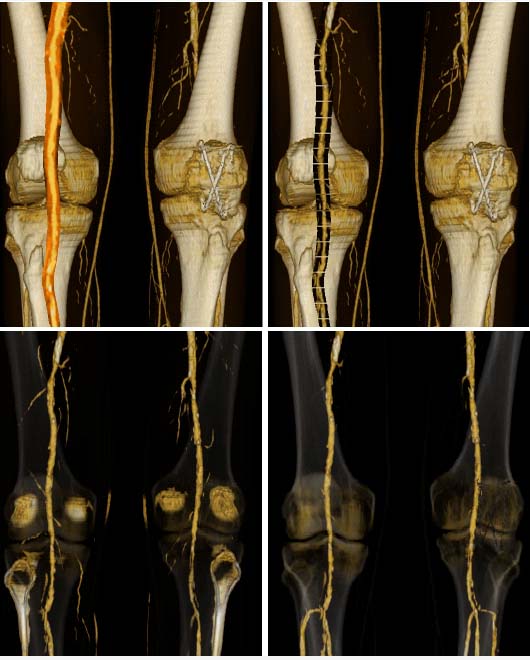
Reliable and complete blood-vessel segmentation is still a challenging problem. This is especially true in the presence of morphologic changes resulting from atherosclerotic diseases. In this paper we take advantage of partially segmented data with approximately identified vessel centerlines to comprehensively visualize the diseased peripheral arterial tree. We introduce the VesselGlyph as an abstract notation for novel focus & context visualization techniques of tubular structures such as contrast-medium enhanced arteries in CT-Angiography (CT-A). The proposed techniques combine direct volume rendering (DVR) and curved planar reformation (CPR) within a single image. The VesselGlyph consists of several regions where different rendering methods are used. Region type, the used visualization method and region parameters depend on the distance from the vessel centerline and on viewing parameters as well. By selecting proper rendering techniques for different regions, vessels are depicted in a naturally looking and undistorted anatomic context. In this paper we furthermore present a way how to implement the proposed techniques in software and by means of modern 3D graphics accelerators.Keywords:focus & context technique, direct volume rendering, curved planar reformation, vessel visualization
Download full paper
Matúš Straka, Michal Cervenansky, Alexandra La Cruz, Arnold Köchl, Miloš Šrámek, Eduard Gröller, Dominik Fleischmann, "The VesselGlyph: Focus & Context Visualization in CT-Angiography", in proceedings of IEEE Visualization 2004, pages 385-392. vg.pdf (4,950 KB)Figures in the paper
BibTeX Entry
@inProceedings{StrakaVis2004,
  title =      "The VesselGlyph: Focus & Context Visualization in
               CT-Angiography",
  author =     "Matúš Straka and Michal Cervenansky and
               Alexandra La Cruz and Arnold Köchl and Miloš
               Šrámek and Meister Eduard Gröller and
               Dominik Fleischmann",
  year =       "2004",
  pages =      "392--385",
  month =      "oct",
  publisher =  "IEEE",
  location =   "Austin, Texas",
  editor =     "IEEE",
  booktitle =  "IEEE Visualization 2004"
}