

Jean-Paul Balabanian, Ivan Viola , Egil Ona, Ruben Patel, Eduard Gröller
Sonar Explorer: A New Tool for Visualization of Fish Schools from 3D Sonar Data
In Data Visualization - EuroVis 2007, pages 155-162. May 2007.
[ paper]
Information
- Publication Type: Conference Paper
- Workgroup(s)/Project(s):
- Date: May 2007
- ISBN: 9783905673456
- Publisher: IEEE
- Location: Norköpping, Schweden
- Lecturer: Jean-Paul Balabanian
- Editor: K. Museth, T. Möller, A. Ynnerman
- Booktitle: Data Visualization - EuroVis 2007
- Conference date: 23. May 2007 – 25. May 2007
- Pages: 155 – 162
Abstract
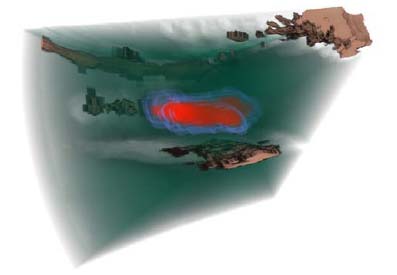
We present a novel framework for analysis and visualization of fish schools in 3D sonar surveys. The 3D sonar technology is new and there have not been applications to visualize the data in 3D. We have created an application called Sonar Explorer that satisfies the requirements of domain scientists. Sonar Explorer provides easy and intuitive semi-automatic fish school tracking and survey map generation. The overall pipeline is described and all pipeline stages relevant for visualization are highlighted. We present techniques to deal with 3D sonar data specifics: highly anisotropic volume data aligned on a curvilinear grid. Domain scientists provide initial impressions on interaction and outlook.Additional Files and Images

Weblinks
No further information available.BibTeX
@inproceedings{balabanian-2007-ant,
  title =      "Sonar Explorer: A New Tool for Visualization of Fish Schools
               from 3D Sonar Data",
  author =     "Jean-Paul Balabanian and Ivan Viola and Egil Ona and Ruben
               Patel and Eduard Gr\"{o}ller",
  year =       "2007",
  abstract =   "We present a novel framework for analysis and visualization
               of fish schools in 3D sonar surveys. The 3D sonar technology
               is new and there have not been applications to visualize the
               data in 3D. We have created an application called Sonar
               Explorer that satisfies the requirements of domain
               scientists. Sonar Explorer provides easy and intuitive
               semi-automatic fish school tracking and survey map
               generation. The overall pipeline is described and all
               pipeline stages relevant for visualization are highlighted.
               We present techniques to deal with 3D sonar data specifics:
               highly anisotropic volume data aligned on a curvilinear
               grid. Domain scientists provide initial impressions on
               interaction and outlook.",
  month =      may,
  isbn =       "9783905673456",
  publisher =  "IEEE",
  location =   "Nork\"{o}pping, Schweden",
  editor =     "K. Museth, T. M\"{o}ller, A. Ynnerman",
  booktitle =  "Data Visualization - EuroVis 2007",
  pages =      "155--162",
  URL =        "https://www.cg.tuwien.ac.at/research/publications/2007/balabanian-2007-ant/",
}