

 Thesis
Information
- Publication Type: Master Thesis
- Workgroup(s)/Project(s): not specified
- Date: October 2007
- TU Wien Library:
- First Supervisor: Helwig Hauser

Abstract
Massive amounts of complex time-dependent information arise in various areas of business, science and engineering. These time series datasets commonly result from the measurement, modeling or the simulation of dynamic processes and contain multiple attributes changing over time. Examples are meteorological data, climate data, financial data, census data, or medical data, to name a few.In this thesis the CurveView for the enhanced interactive visual analysis of multidimensional and large time series data is presented. Two approaches are proposed, one for the interactive visual representation of the data, and so-called brushing techniques allowing the user to select certain interesting subsets of the data (i.e., features) in an intuitive and interactive way. The goals are to enable analysts to gain insight into their data sets, to create, verify or reject hypotheses based on the data, and to explore the temporal evolution of different attributes in order to detect expected structures and to discover unexpected features. The presented solution is integrated into SimVis, a multiple-views system for the visual analysis of time-dependent simulation results.
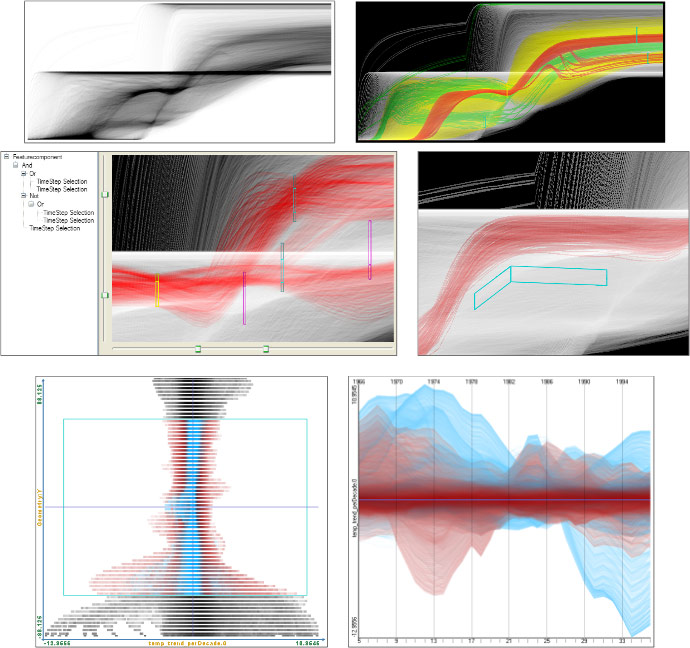
The data is visualized using focus+context visualization techniques: important or selected portions of the data (focus) are visually accented, while the rest of the data (context) is shown in a less prominent style. In doing so, enhanced navigation and orientation is provided to the user. By the application of customizable transfer functions, general data trends, visual structures and patterns can be emphasized even within dense regions of the visualization. On the other hand, so-called outliers, which denote time series in low populated areas of the display or important (ie, brushed) data items hidden in regions of context information, are discriminable in the visualization. By the application of binning techniques large amounts of time-dependent information are transformed into a reduced but still meaningful representation which can be depicted at interactive frame rates.
Furthermore, interactive brushing techniques are provided to the user for analysis purposes. Thus, complex time-dependent features can be specified by applying fuzzy classification to the time series data. Two kinds of brushes exist in the CurveView: similarity-based brushes where time series are classified according to their similarity to a user-defined pattern directly sketched in the view; and time step brushes, which select time series running through a certain area of the view. In SimVis, the interrelations between the specified features in multiple time-dependent dimensions can be analyzed visually using multiple linked views that show different attributes (i.e., dimensions) of the data.
Additional Files and Images

Weblinks
No further information available.BibTeX
@mastersthesis{Kehrer-2007-Mas,
  title =      "Integrating Interactive Visual Analysis of Large Time Series
               Data into the SimVis System",
  author =     "Johannes Kehrer",
  year =       "2007",
  abstract =   "Massive amounts of complex time-dependent information arise
               in various areas of business, science and engineering. These
               time series datasets commonly result from the measurement,
               modeling or the simulation of dynamic processes and contain
               multiple attributes changing over time. Examples are
               meteorological data, climate data, financial data, census
               data, or medical data, to name a few.  In this thesis the
               CurveView for the enhanced interactive visual analysis of
               multidimensional and large time series data is presented.
               Two approaches are proposed, one for the interactive visual
               representation of the data, and so-called brushing
               techniques allowing the user to select certain interesting
               subsets of the data (i.e., features) in an intuitive and
               interactive way. The goals are to enable analysts to gain
               insight into their data sets, to create, verify or reject
               hypotheses based on the data, and to explore the temporal
               evolution of different attributes in order to detect
               expected structures and to discover unexpected features. The
               presented solution is integrated into SimVis, a
               multiple-views system for the visual analysis of
               time-dependent simulation results.  The data is visualized
               using focus+context visualization techniques: important or
               selected portions of the data (focus) are visually accented,
               while the rest of the data (context) is shown in a less
               prominent style. In doing so, enhanced navigation and
               orientation is provided to the user. By the application of
               customizable transfer functions, general data trends, visual
               structures and patterns can be emphasized even within dense
               regions of the visualization. On the other hand, so-called
               outliers, which denote time series in low populated areas of
               the display or important (ie, brushed) data items hidden in
               regions of context information, are discriminable in the
               visualization. By the application of binning techniques
               large amounts of time-dependent information are transformed
               into a reduced but still meaningful representation which can
               be depicted at interactive frame rates.  Furthermore,
               interactive brushing techniques are provided to the user for
               analysis purposes. Thus, complex time-dependent features can
               be specified by applying fuzzy classification to the time
               series data. Two kinds of brushes exist in the CurveView:
               similarity-based brushes where time series are classified
               according to their similarity to a user-defined pattern
               directly sketched in the view; and time step brushes, which
               select time series running through a certain area of the
               view. In SimVis, the interrelations between the specified
               features in multiple time-dependent dimensions can be
               analyzed visually using multiple linked views that show
               different attributes (i.e., dimensions) of the data.",
  month =      oct,
  address =    "Favoritenstrasse 9-11/E193-02, A-1040 Vienna, Austria",
  school =     "Institute of Computer Graphics and Algorithms, Vienna
               University of Technology ",
  URL =        "https://www.cg.tuwien.ac.at/research/publications/2007/Kehrer-2007-Mas/",
}