

WS or SS 2.0 h (3.0 ECTS), 186.175
Organizers
Hsiang-Yun Wu (contact person)
Eduard Gröller
Supervisors
Aleksandr Amirkhanov
Christoph Heinzl
David Kouřil
Haichao Miao
Peter Mindek
Renata Raidou
Nicolas Grossmannu
Manuela Waldner
Tobias Klein
Hsiang-Yun Wu
Quicklinks
Hot News
[IMPORTANT] Now we have a clear instruction from TU Wien . The lecture will not happen physically in the seminar room tomorrow. Instead, we will be recording the lectures and putting them on TUWEL.
We are sorry for this inconvenience. Please enroll in the TUWEL lecture to keep everything up to date.
Since we do not receive any clear instructions about the coronavirus strategy from TU (until 16:48, March 10th), the introductory lecture will happen in the seminar room on Thursday.
INITIAL MEETING: (Vorbesprechung) for SS 2020 will be held on Wednesday, 11th March 2020 at 11:00 in the seminar room of the
institute 186 (Favoritenstr. 9-11 / 5.floor).
REMARK: (1) If you want to work as a group, at least one of the member needs to sign the topic on TUWEL. Then send the organizers a message so that we will add another member to the group. (2) All information will be updated on TUWEL, so please check the link constantly.
REGISTRATION. [IMPORTANT] From this semester, you have to register the seminar from TUWEL. The registration is considered successful only after you register your topic and submit the initial list of literature.
COMMUNICATION is done by either e-mail or messages through TUWEL.
SUBMISSIONS. All deadlines are at 23:59 of the given day. Submission on the next day after the deadline day will result in deduction of certain grade percents from the final grading, as stated in Grading Criteria section.
General information
Goal:
The goal of this seminar is to write and present a state of the art report and to write a review on another report. A member of the teaching staff will guide and help students in acquiring the scientific material and writing the report. The students are also expected to present their work in front of the other students. Students will have the option to work alone or in groups of two.Tasks for the students:
Teaching staff will evaluate and grade students based on the following output:- A list of literature that a student intends to review. This document will be regarded as an official seminar registration of the student.
- Attendance of the lectures "Forschung und wie sie funktioniert" by Professor Eduard Gröller, the lecture "Wie halte ich einen Vortrag" by Professor Werner Purgathofer, and the lecture "Wie schreibt man eine wissenschaftliche Arbeit" by Professor Michael Wimmer. You can ask for a waiver in case you have already attended one of these talks.
- A written state of the art report in the form of a scientific paper. We strongly encourage that the reports are composed in LaTeX. The report must have a minimum of 8 written pages (15-16 pages, if students are working in groups of two). The report has to be written in English.
- A written review of one of the papers of another student.
- A presentation in English followed by a discussion. The duration of the presentation will be announced after the literature submission deadline. The slides are to be submitted prior to the talk to the organizer.
- Active discussion participation is expected after the presentation of other students.
Important Dates:
- 11.03.2020: Initial meeting at 11:00 - 12:00 in the seminar room 186 (Favoritenstr. 9-11 / 5.floor). In this meeting the topics will be presented and the date for topic assignmentwill be announced. Having your topic chosen in mind, subscribe to your topic group on TUWEL.
- 26.03.2020: Submit list of literature on TUWEL. This will be regarded as the official seminar registration.
- Attend the following lectures (they all take place in the seminar room of the
institute 186 (Favoritenstr. 9-11 / 5.floor):
- 01.04.2020 (Wed), 11:00-13:00 (s.t.): "Wie schreibt man eine wissenschaftliche Arbeit" / "How to write a scientific publication", by Professor Wimmer
- 21.04.2020 (Tue), 11:00-13:00 (s.t.): "Forschung und wie sie funktioniert" / "Science and how it works", by Professor Gröller
- 13.05.2020 (Wed), 11:00-13:00 (s.t.): "Wie halte ich einen Vortrag" / "How to do a presentation", by Professor Purgathofer
- 20.04.2020: Submit a report on TUWEL. This report version will be used as a basis for the review process. (The structure should be complete and it should have minimum 6 pages for the review process.)
- 25.04.2020: Receive a review form and a report from another student. (Practical Tips and Tricks for Paper Writing is helpful for identifying the quality of the report.)
- 18.05.2020: Submit the completed review on TUWEL.
- 22.05.2020: Receive two reviews (one from your supervisor and one from another student). Use the information provided in the reviews to update your report accordingly.
- 17.06.2020: Submit the slides for your presentation on TUWEL. The slides should be in Power-Point or Open-Office format. The slides will be copied on the presentation machine in the seminar-room. No own devices will be allowed.
- 18.06.2020: Talks will be held 9:00 - 17:00 and the attendance is mandatory. In the morning session, talks will be held 9:00 - 12:00 in the seminar room 186 (Favoritenstr. 9-11 / 5.floor) and In the afternoon session, talks will be held 13:00 - 17:00 in the seminar room ZEMANEK (Favoritenstr. 9-11 / EG).
- 21.06.2020: Submit your final report on TUWEL.
Grading Criteria
- The quality of the written report is worth 40% of the grade
- The quality of the talk is worth 30% of the grade
- The quality of the review is worth 20% of the grade
- Active discussion participation is worth 5% of the grade
- Attendance during the lectures is worth 5% of the grade
Submitting the report after deadline is penalized by deduction of 10% from the final grading. Additionally, every started day after deadline when the report has not yet been submitted is penalized by deduction of another 10% (missing the deadline means deduction of at least 20%).
Plagiarism:
All the literature that is reviewed during the seminar has to be placed in the reference section of the report. You can have further information about referencing and examples of what is plagiarism here. We are all expected to abide by professional scientific ethics and make sure that the work is not plagiarized in any sense.Topics
Topic 1: Visualization and Uncanny Valley
With the development of renderings techniques the problem of uncanny valley is arising more often. This might be an issue when a visualization concerts previewing an outcome of a medical treatment, for example, plastic surgery or dental treatment. In this topic, the possible ways to avoid the uncanny valley must be explored.
Topic 2: Aesthetic Visualization
Even though the human aesthetic is subjective, often people have similar idea what is aesthetic and what is not. These rules are often studied and investigated in areas as art, architecture, and design. In this topic, the student must explore possible ways to formalize human aesthetic and how this knowledge can be delivered to the general public.
Topic 3: Visualization Techniques for AR/VR Applications in Material Science
Virtual and augmented reality has come to stay and is used in many application domains. AR and VR feature the potential to boost data analysis through more intuitive insights and more intuitive interactions; the transfer of the spatiality is intuitive and probably more effective than when rendering the same scene on a 2D monitor. Virtual and augmented reality have the potential to help in a variety of tasks such as quality control / parts inspection, the characterization of the micro-structure of materials, or the visualization of atomic structures. Your task is to provide an overview on the state of the art regarding methods in virtual and augmented reality: where these be used to support material science tasks, what are their benefit, what are their limitations.
Topic 4: Guidance Methods for Transfer Function Specification
When directly visualizing (potentially multi-variate) volume datasets, a transfer function is required. Current tools for this purpose are often unintuitive; its often not clear how changes in the transfer function will affect the resulting visualization; using volume visualization tools therefore first requires a certain experience by the user, as well as often a trial and error approach to color the volume in the desired fashion. Recently, methods have emerged that simplify this process, or provide guidance to the user. Your task is to provide a survey on the state of the art of methods guiding users in setting up transfer functions for volume visualization.
Topic 5: Real-time Transparency
In order to render transparent or translucent objects in real-time using common graphics APIs that utilize rasterization, several techniques have been introduced. In this topic you will research the most popular techniques, summarize the current state of the art, and suggest which are the advantages and shortcommings of each technique.
Topic 6: Real-Time Methods for Fluids Simulation
Fluids simulation has been an extensively researched topic in computer graphics, mainly to be used in computer generated imagery for movies. Alongside that, methods that work well enough even in real-time realm have been presented. In this topic we are interested in what methods are there for simulation of fluids interactively (in games for example), and what are the trade-offs that we have to consider when choosing the right method for our application.
Topic 7: Abstraction in Visualization
How is the concept of abstraction used in the context of visualization. The goal is to discuss the characteristics and the application of abstraction for visualizing complex scientific data.
M. van der Zwan, W. Lueks, H. Bekker, and T. Isenberg. Illustrative
molecular visualization with continuous abstraction. Computer Graphics
Forum, 30(3):683–690, May 2011.
S. McCloud. Understanding Comics: The Invisible Art. HarperCollins
Publishers, Inc., New York, 1993.
Topic 8: 3D Modeling in Virtual Reality
Immersive VR environment can be tremendously useful for the learning, training and design. What are the interaction required for building three-dimensional objects in VR?
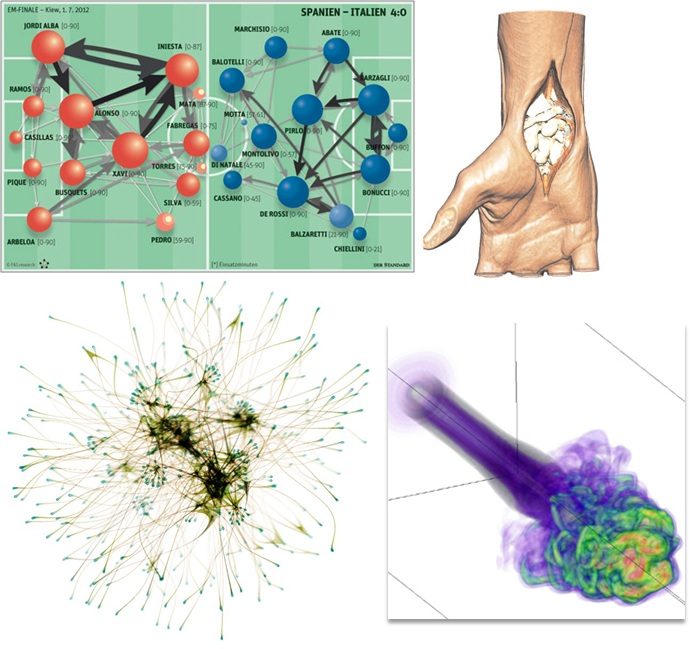
Topic 9: Visualization of Bipartite / k-Partite Graphs
Bipartite or k-partite graphs are a special class of graphs whose nodes are divided into two or k sets. These sets are independent, which means that there are no edges connecting nodes of the same set. K-partite graphs are ubiquitous and can be found in social networks, where nodes can be persons which are associated with projects, or in biology, where nodes can be genes and conditions, and edges describe the expression of genes under these conditions. There are different ways how to visualize k-partite graphs, including linked lists, node-link diagrams, and matrix views. This report should describe existing visualization techniques, as well as interaction techniques to explore bipartite graphs.
Topic 10: Visualization of Networks in Virtual Reality
There is a lot of scientific evidence that immersive 3D visualization of graphs helps users to detect patterns in complex networks. Graphs have been visualized in virtual and augmented reality already for decades. Nowadays mature and affordable VR hardware makes immersive analytics attractive for a very wide range of potential users. In this survey, the history and state-of-the-art of network visualization in VR should be summarized. The report should provide an overview of the employed graph rendering and layout techniques, interaction techniques, and the navigation.
Topic 11: Animated Visual Storytelling
In this video, we see how the average American spends its day from sleep to work lunch and leisure time back to sleep. The goal of visual storytelling is to intuitively explain the underlying patterns in data to a broader audience. In this report, the goal is to analyze current state-of-the-art methods in information visualization that employ animation, with a focus on tools that support the automatic creation of these stories.
Topic 12: Parallel Coordinates
Parallel Coordinates are a common technique to visualize multi-dimensional data and have been applied to a large range of usage scenarios. However, they are difficult to comprehend for new users. In this report, recent advances on this topic should be analyzed especially considering approaches that make them more interpretable and provide better insights into the data. In this regard, the use of color and blending should be discussed.
Topic 13: Machine Learning in Computer Graphics
Computer graphics are all about simplifying the real world and displaying it with a computer. A lot of tasks, for which specialized algorithms have been used up until now, can be nowadays replaced by machine learning methods. This approach significantly improves the quality of the results in various fields of computer graphics, such as rendering, image processing, and animation.
Topic 14: Special Effects in Computer Graphics
This topic investigates the special effects in computer graphics.
Topic 15: Using Physicalization for Medical Visualization
Survey on less traditional ways of conducting medical visualizations, such as the interactive printable volvelle of stoppel.
Volvelles are carefully designed interactive wheel charts and have been used for centuries to present a wide variety of data.
The approach of Stoppel allows to directly create a volvelle from an interactive volume visualization setup.
What other ways are there to do medical visualization, apart from the typical pc or tablet setting?
Topic 16: Visual Analytics for Rendering
Visual analytics helping the rendering (like in the right image) – for example to find better parameterizations of algorithms.
Visual analytics combined with rendering (like in the left) – to address challenges in the integration of the two domains.
Topic 17: DSLs in Visualization
Domain-specific languages (DSLs) offer increased expressiveness compared to general purpose programming languages and higher flexibility compared to graphical user interfaces at low computational overhead.
By abstracting the details of the computer soft- and hardware, the user can focus on the relevant (i.e., domain-specific) problems.
A well-chosen Domain-specifc language improves the productivity for developers and the communication with domain experts.
It makes it easier to understand a complicated block of code, thus improving the productivity of those working with it.
It can also make it easier to communicate with domain experts, by providing a common text that acts as both executable software and a description that domain experts can read to understand how their ideas are represented in a system.
Topic 18: Procedural Animation
A procedural animation is a type of computer animation, used to automatically generate animation in real-time to allow for a more diverse series of actions than could otherwise be created using predefined animations.
Procedural animation is used to simulate particle systems (smoke, fire, water), cloth and clothing, rigid body dynamics, and hair and fur dynamics, as well as character animation.
Topic 19: Network Visualization for Biological Pathways
Networks are well-known representations for describing a relationship of entities between data samples. Thus, it is also intuitive to use networks as a base for visually describing biological interactions. In this seminar, network visualization techniques should be categorized and organized as a meaningful taxonomy.
Topic 20: Machine Learning in Graph Visualization
Machine Learning (ML) has been widely used to solve several visualization problems by learning implicit rules from the existing drawings. This topic investigates the conventional ML approaches and tries to clarify the strengths and weaknesses of the current state-of-the-art in graph visualization.
Downloads and Links
Downloads
- LaTeX templates, ACM SIGGRAPH (rendering group) or IEEE TVCG (visualization group), to be used for composing the report
- Libre Office or PowerPoint template for the student presentations
- "Forschung und wie sie funktioniert" (by E. Gröller).
- "Wie schreibt man eine wissenschaftliche Arbeit" (by M. Wimmer).
- "Wie halte ich einen Vortrag" (by W. Purgathofer).
Paper search engines
- Citeseer
- Free preprints of published and not (yet) published papers
- The Collection of Computer Science Bibliographies
- ACM Digital Library, SIGGRAPH Proceedings
- IEEE Computer Society Digital Library
Tips for writing papers and preparing presentations
- How to write a scientific paper
- Important Tips for presentation (in German)
- Tips and Suggestions for Presentations
- A not so short introduction to LaTeX
- Netspeak, one word leads to another.
- Thesaurus, an online engine to search thesaurus.
- Editsaurus, a free online grammar and spelling checker
- Grammarly, a free online grammar and spelling checker
- Overleaf, a free online LaTeX editor
- TeXworks, a free cross-platform LaTex package (Linux, MacOS, Windows)
- Tex Live, a free cross-platform LaTex package (Linux, MacOS, Windows)
- LaTeX Workshop, a free plug-in for Visual Studio Code
- MiKTeX, free distribution of LaTeX for Microsoft Windows
- TexnicCenter is an IDE for developing LaTeX documents on Microsoft Windows