Color-Table Animation of Fast Oriented Line Integral Convolution for Vector Field Visualization
by Siegrun Berger and Eduard Gröller.
Project Duration: 1997 - 1998
A detailed description is given in the paper
Color-Table Animation of Fast Oriented Line
Integral Convolution for Vector Field Visualization
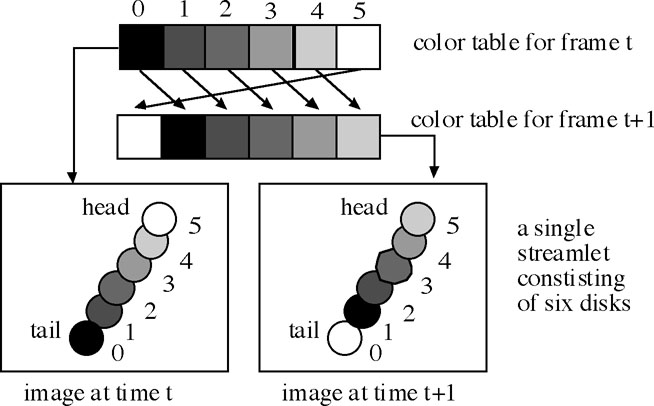
Fast Oriented Line Integral Convolution (FROLIC) is a fast variant of Line Integral Convolution (LIC) and illustrates 2D vector fields by approximating streamlets by a set of disks with varying intensity. FROLIC does not only show the direction of the flow but also the orientation. Each streamlet consists of a sequence of disks with decreasing intensity from head to tail. Each streamlet is calculated for a short but fixed period of time. The length of the streamlet indicates the velocity of the underlying flow field.
As a streamlet consists of a set of disks with decreasing intensity from head to tail, cycling the linearly decreasing intensity function conveys to the viewer the impression of motion. Color-table animation is a very efficient approach for animating FROLIC images. With a color table the intensity of a pixel is specified indirectly. Each pixel is assigned a short color-table index, which points to a specific entry in the color table. Available intensities or colors are stored in the color table itself. Color-table animation changes the color table instead of changing the corresponding image. As a color table is small in size, e.g., 256 entries, this can be done very fast. The color table holds the intensity ramp, i.e., successive color-table entries contain increasing intensity values. Adjacent disks are represented by consecutive color-table indices. Animation is achieved by cycling the intensity values in the color table itself.
FROLIC is implemented as a combined application using Mathematica for the calculation and Visual C++ for the visualization of the dynamical system. A Mathematica Notebook handles the interaction between the user and Mathematica. It is used to specify the dynamical system. A module written in Mathematica numerically integrates the dynamical system and writes the result on a file. The Visual C++ application reads the result file and visualizes the vector field.
You can download the software ct.zip.
Institute of Computer Graphics - Visualization
and Animation Group - Research

This
page is maintained by RainerWegenkittl. It was last updated on April
22, 1997.
If you have any comments, please send a message to wegenkittl@cg.tuwien.ac.at.