


Next: Acquisition of Optimally Regular
Up: Optimal Regular Volume Sampling
Previous: Baseband Optimal Sampling
Subsections
Implementation Details
In order to use a bcc grid in practice we have to address some
inherent implementation issues. First, we must think about how to
organize the grid in memory. We present a scheme which stores the
sampling points in a three-dimensional array. The addressing scheme is
of special importance, since we want to take advantage of the implicit
ordering in regular grid structures. Next we describe the slight
modifications necessary to use splatting on bcc grids. Here we need to
address issues of interpolation. In order to incorporate shading in
our rendering algorithm we describe two methods for estimating
gradients on grid points of a bcc lattice.
Storage scheme
Figure 5:
Different indexing schemes. The image on the left
corresponds to Eq. 3. The figure
on the right corresponds to Eq. 20
|
|
For the sake of simplicity and clarity of figures, we first present
our storage scheme in 2D, then extend it to 3D.
In 2D the optimal sampling pattern is hexagonal sampling. Hexagonal
sampling as described by Eq. 3,
results in rather awkward indexing as we still want to sample a
rectangular area. The meaning of the matrix in
Eq. 3 is to shift the  row by
the amount
row by
the amount
 . Since this holds for infinite long rows,
the result would be the same to shift the same row by
. Since this holds for infinite long rows,
the result would be the same to shift the same row by
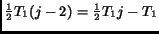 . Extending this idea and since we actually like
to describe a finite, rectangular area, we shift only rows with odd
index which is achieved by the following matrix:
. Extending this idea and since we actually like
to describe a finite, rectangular area, we shift only rows with odd
index which is achieved by the following matrix:
 |
(20) |
The effect is illustrated in Fig. 5. On the left, the
result of applying Eq. 3 can be seen
whereas the effect of applying Eq. 20 is
depicted on the right.
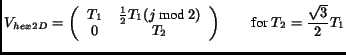
The same problem exists in 3D. However, the solution is as simple as
in 2D. The following matrix
 |
(21) |
shifts only planes with odd z-coordinates half a unit in x and y
direction. The result is that the slices with even z coordinates make
up a 3D Cartesian grid, the slices with odd z coordinates also make up
a 3D Cartesian grid which is shifted to the centers of the
first grid. Fig. 6 shows a bcc grid with the
two inter-penetrating Cartesian grids marked differently. In practice
we still store the data in a 3D array with an implicit shift of slices
with odd z coordinates.
Figure 6:
A bcc grid interpreted as two inter-penetrating Cartesian grids.
|
|
Adapting Westover`s splatting algorithm [19] to bcc
grids is straightforward. This algorithm gains its power by using
spherical reconstruction kernels. These kernels have a spherical
extent in the frequency domain. Hence these kernels preserve a
spherical region during the reconstruction process. Since the aliased
spectra for the hexagonal grid are redistributed so that they do not
overlap with the primary spectrum, we can use the existing spherical
kernels without any modifications.
Since the data is still organized in a 3D array, we traverse it in a
back to front manner. Care has to be taken when traversing in
z-direction as planes with odd and even z-coordinates have to be
separated. Before applying the transformation matrix we apply the
sampling matrix (Eq. 21) to shift the voxels to the
correct position. One more thing has to be changed in existing code:
the computation of gradients for shading. For this purpose, we
adapted central differences to bcc grids.
Central Differences on bcc grids
Gradients are rather important in volume visualization. They are most
often used for classification and shading. Therefore, we need to be
able to compute gradients on bcc grids. The most commonly used
method to estimate gradients is the central differences method. There
are two ways to adapt this method to bcc grids.
The first idea exploits the fact that we have a Cartesian grid
structure in all the slices that are parallel to a major axis
direction. Hence partial derivatives in each direction can be computed
through standard central differences. However, using our indexing
scheme we have to adopt the following equation for computing the
central difference in the z direction:
![$\displaystyle f_z[x,y,z] = \frac{1}{2T}(f[x,y,z+2] - f[x,y,z-2])$](img65.gif) |
(22) |
This method requires exactly as many operations as central differences
on Cartesian grids. The conceptual problem with this method is that we
do not use the actual closest points in order to estimate the
derivatives.
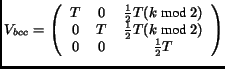
This can be rectified in our second method. For the second method we
follow the philosophy that the eight closest points should have the
main impact on the reconstructed value. Hence we are computing the
average of the central differences at each edge of the cubic cell that
the current point is located in (compare Fig. 4). This
corresponds to applying an analytic, spherically symmetric, trilinear
derivative filter at grid points, resulting in the following formulas
for the partial derivatives:
with
 and
and
 |
(24) |
The introduction of
 and
and  are due to the
properties of our storage scheme.
are due to the
properties of our storage scheme.
This method requires 8 operations per partial derivative as opposed to
one subtraction per partial derivative for Cartesian grids. However,
as we are calculating the gradients in a preprocessing step, this has
no major impact on the rendering performance.
Next: Acquisition of Optimally Regular
Up: Optimal Regular Volume Sampling
Previous: Baseband Optimal Sampling
Thomas Theußl
2001-08-05
![\includegraphics[width=14cm]{pics/sampling_scheme.eps}](img58.gif)
![\includegraphics[width=8cm]{pics/bccAs2Cartesians.eps}](img64.gif)
![$\displaystyle \frac{1}{4T}\sum_{\substack{i,j \in \{0,1\}\\ k \in \{-1,1\}}}h(i)f[\overline{x}-i,\overline{y}-j, z-k]$](img68.gif)
![$\displaystyle \frac{1}{4T}\sum_{\substack{i,j \in \{0,1\}\\ k \in \{-1,1\}}}h(j)f[\overline{x}-i,\overline{y}-j, z-k]$](img70.gif)
![$\displaystyle \frac{1}{4T}\sum_{\substack{i,j \in \{0,1\}\\ k \in \{-1,1\}}}h(k)f[\overline{x}-i,\overline{y}-j, z-k]$](img72.gif)