

Wendelin Muth
Real-Time Volumetric Rendering of Meteorological Cloud Data
[ thesis]
Information
- Publication Type: Bachelor Thesis
- Workgroup(s)/Project(s):
- Date: March 2026
- Date (Start): October 2025
- Date (End): March 2026
- Matrikelnummer: 12226614
- First Supervisor: Manuela Waldner

Abstract
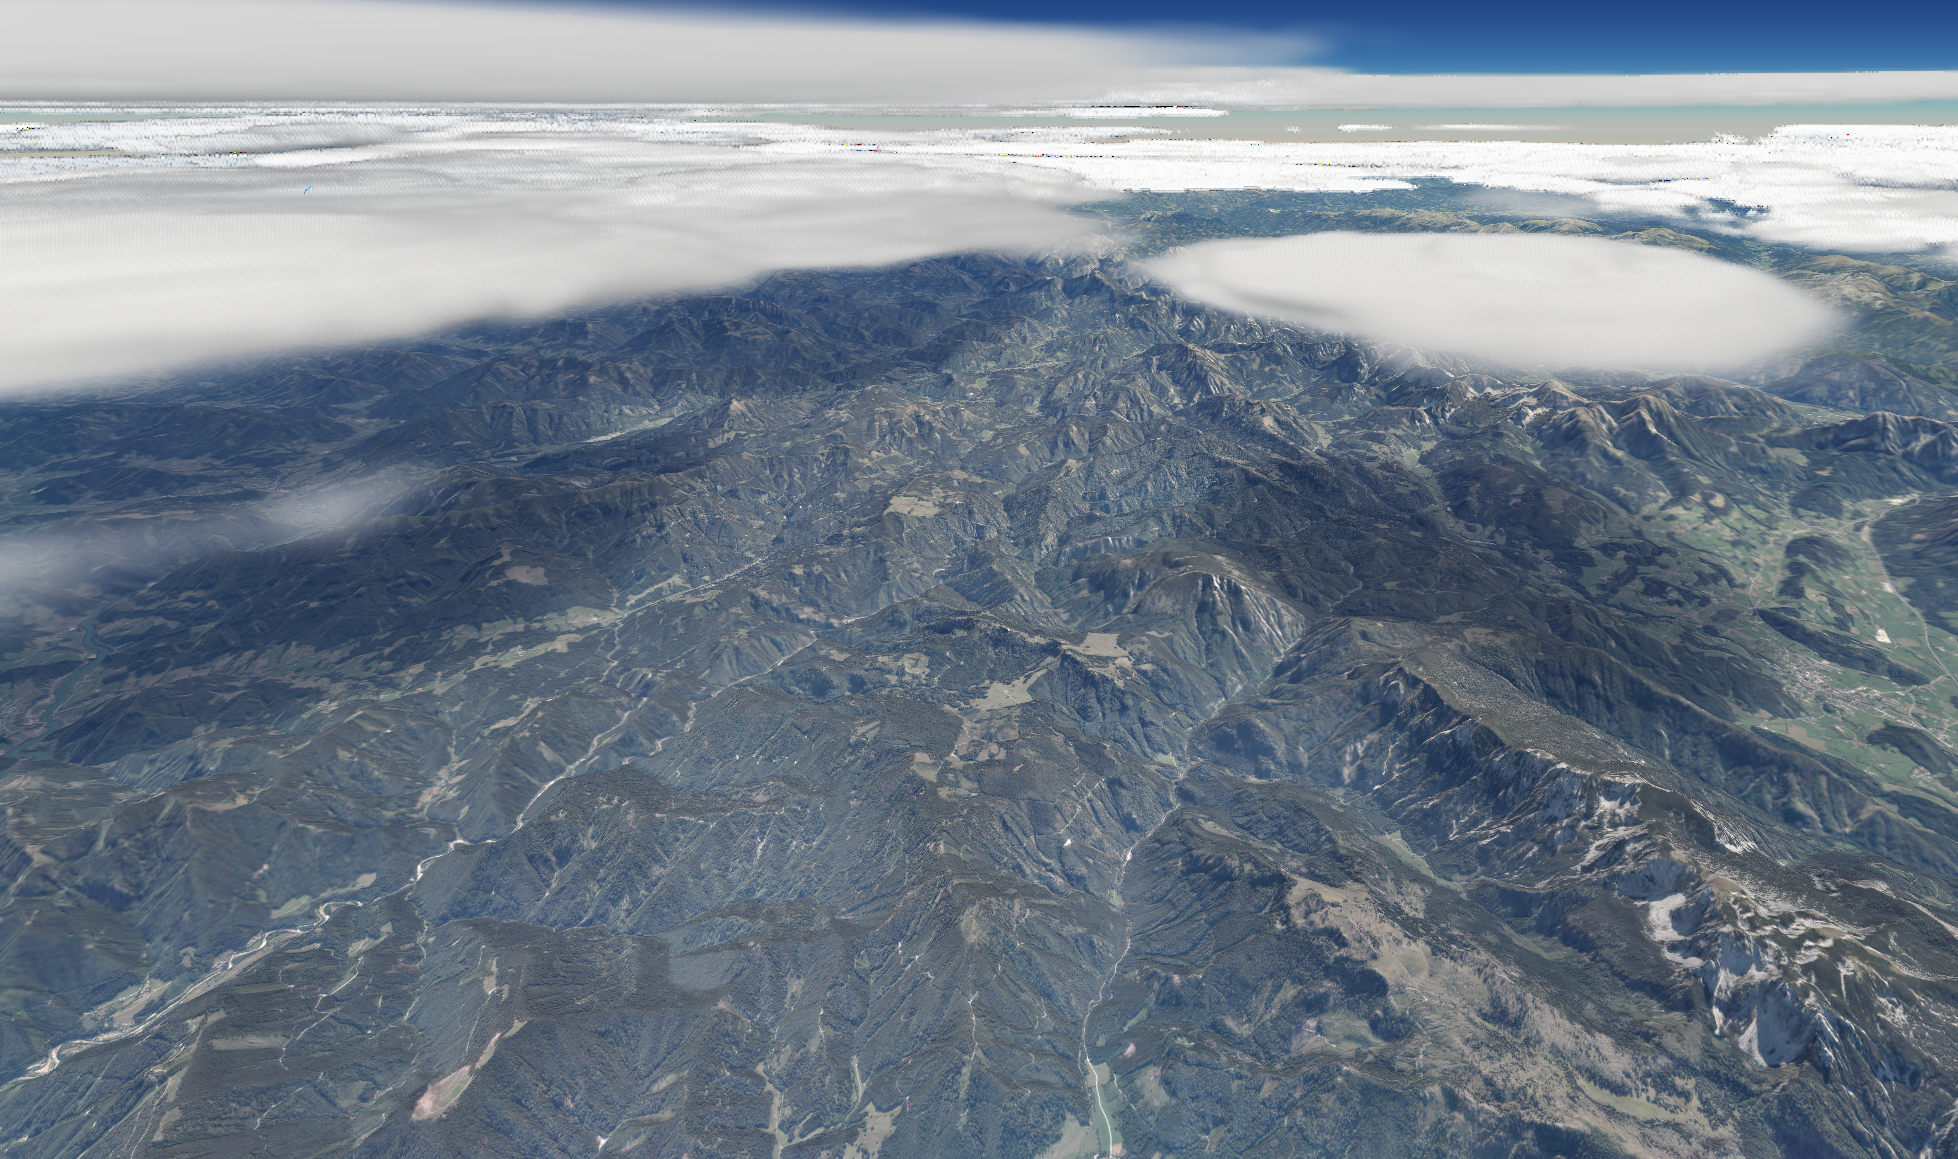
Traditional meteorological visualizations collapse the vertical structure of the atmosphere into two-dimensional map overlays, losing precisely the information most relevant in complex terrain. Expert tools for three-dimensional atmospheric exploration exist, but target domain scientists on dedicated workstation infrastructure. This thesis presents a pipeline for the real-time volumetric rendering of meteorological cloud data within the weBIGeo web-based geographic visualization platform, with the goal of making cloud structure intuitively readable to general users in a standard web browser. The pipeline transforms hourly ICON-D2 forecast output into a compressed, streamable tile hierarchy that a WebGPU ray-marcher samples at interactive frame rates. Preprocessing a single forecast timestamp completes in approximately 33 s of compute time, producing a tile hierarchy of roughly 86MiB on average. Rendering cost is well within interactive bounds: even under high cloud coverage, the cloud pass consumes around 2.25ms of GPU time, a small fraction of the 33ms budget for 30 fps. Qualitative evaluation against EUMETSAT satellite imagery shows that large-scale cloud patterns are reproduced with reasonable fidelity. Comparison against webcam imagery reveals three concrete limitations: the coarse and non-uniform vertical resolution of the source data is insufficient to resolve sharp fog layer boundaries, the sub-grid density distribution does not preserve the character of small cloud elements such as wispy puffs, and the tile resolution is too coarse to encode the surface texture of individual cumulus cells. The system is best understood as a large-scale atmospheric context layer rather than a precise local forecast tool.Additional Files and Images
Additional images and videos

Additional files

Weblinks
BibTeX
@bachelorsthesis{muth-2026-clouds,
  title =      "Real-Time Volumetric Rendering of Meteorological Cloud Data",
  author =     "Wendelin Muth",
  year =       "2026",
  abstract =   "Traditional meteorological visualizations collapse the
               vertical structure of the atmosphere into two-dimensional
               map overlays, losing precisely the information most relevant
               in complex terrain. Expert tools for three-dimensional
               atmospheric exploration exist, but target domain scientists
               on dedicated workstation infrastructure. This thesis
               presents a pipeline for the real-time volumetric rendering
               of meteorological cloud data within the weBIGeo web-based
               geographic visualization platform, with the goal of making
               cloud structure intuitively readable to general users in a
               standard web browser. The pipeline transforms hourly ICON-D2
               forecast output into a compressed, streamable tile hierarchy
               that a WebGPU ray-marcher samples at interactive frame
               rates. Preprocessing a single forecast timestamp completes
               in approximately 33 s of compute time, producing a tile
               hierarchy of roughly 86MiB on average. Rendering cost is
               well within interactive bounds: even under high cloud
               coverage, the cloud pass consumes around 2.25ms of GPU time,
               a small fraction of the 33ms budget for 30 fps. Qualitative
               evaluation against EUMETSAT satellite imagery shows that
               large-scale cloud patterns are reproduced with reasonable
               fidelity. Comparison against webcam imagery reveals three
               concrete limitations: the coarse and non-uniform vertical
               resolution of the source data is insufficient to resolve
               sharp fog layer boundaries, the sub-grid density
               distribution does not preserve the character of small cloud
               elements such as wispy puffs, and the tile resolution is too
               coarse to encode the surface texture of individual cumulus
               cells. The system is best understood as a large-scale
               atmospheric context layer rather than a precise local
               forecast tool.",
  month =      mar,
  address =    "Favoritenstrasse 9-11/E193-02, A-1040 Vienna, Austria",
  school =     "Research Unit of Computer Graphics, Institute of Visual
               Computing and Human-Centered Technology, Faculty of
               Informatics, TU Wien ",
  URL =        "https://www.cg.tuwien.ac.at/research/publications/2026/muth-2026-clouds/",
}