

 thesis
Information
- Publication Type: Master Thesis
- Workgroup(s)/Project(s): not specified
- Date: June 2023
- Date (Start): May 2022
- Date (End): May 2023
- TU Wien Library:
- Second Supervisor: Adam Celarek

- Diploma Examination: 7. June 2023
- Open Access: yes
- First Supervisor: Manuela Waldner
- Pages: 114
- Keywords: risk visualization, real-time visualization, avalanche risk, terrain visualization, 2.5D mapping
Abstract
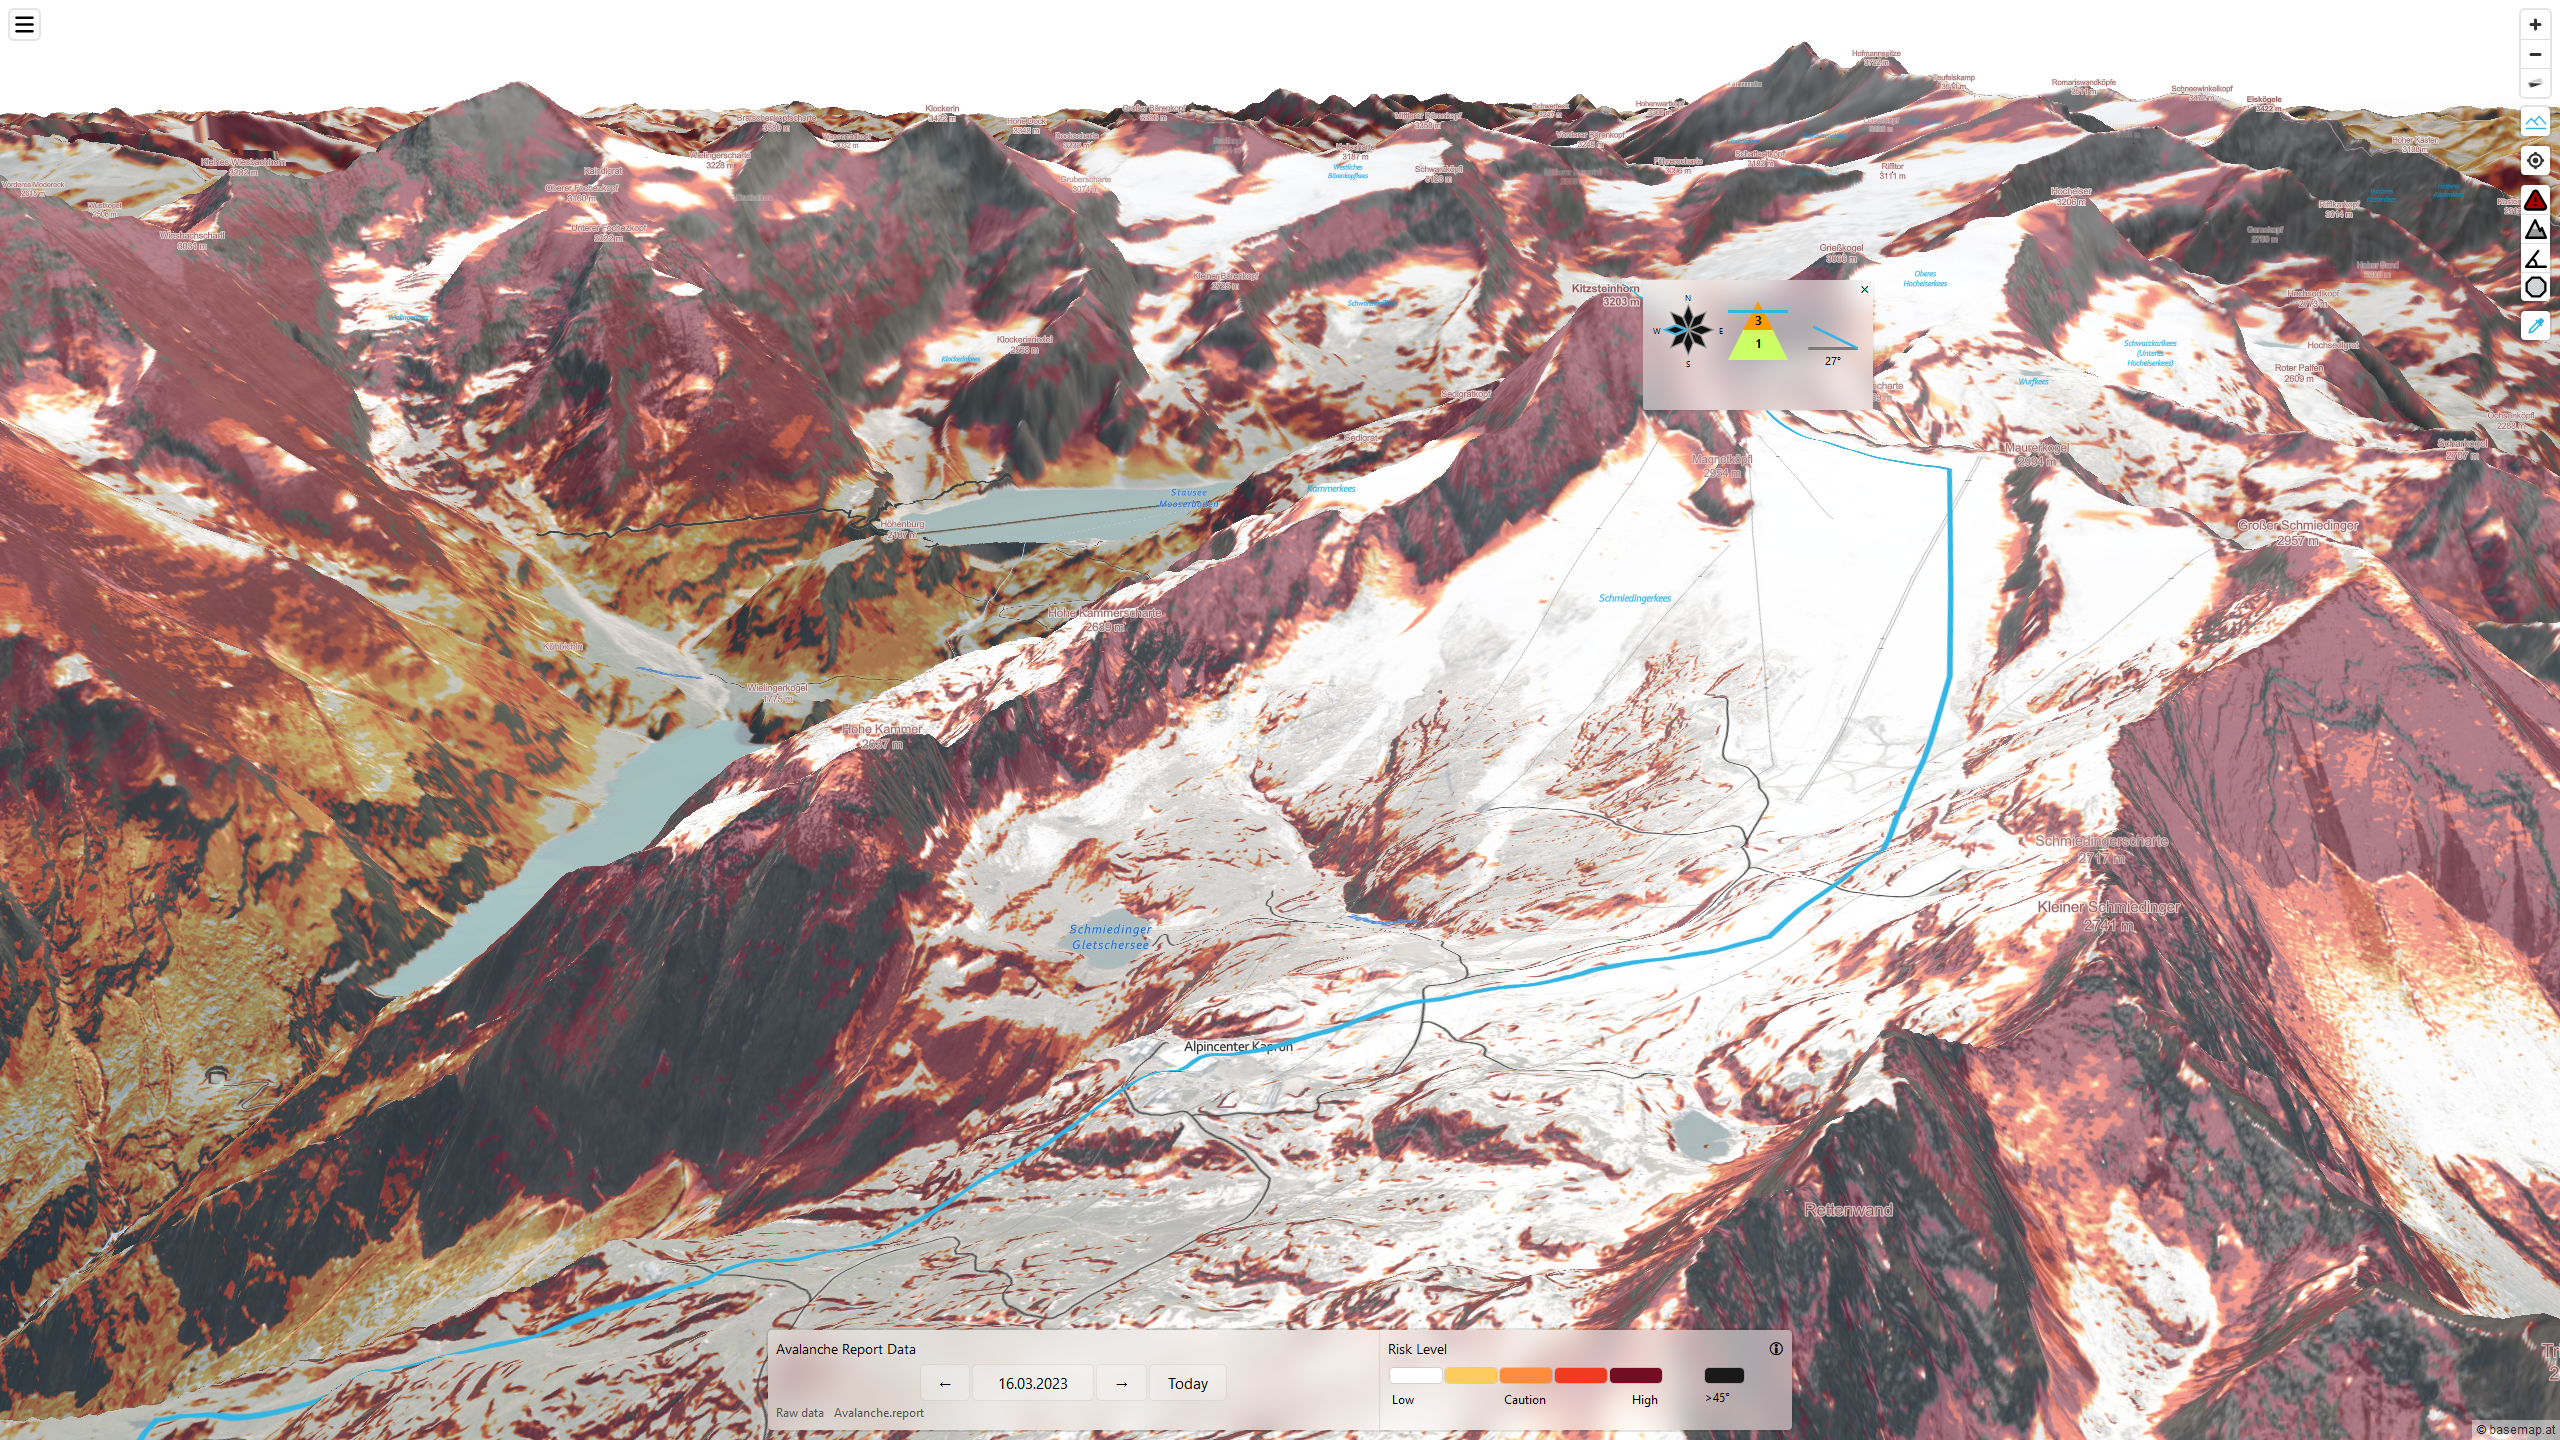
Every winter season reports of fatal avalanche accidents in the Alps are part of the news cycle. Data for tour planning with avalanche risk evaluation is available to recreationists in the form of daily avalanche reports and outdoor maps. These data are, however, distributed across different sources and have to be manually integrated by the end user to arrive at a risk value for a given tour. Risk reduction methods provide a framework for this integration process and thereby allow mountaineers to judge the overall risk and determine potential high-risk areas beforehand. We present an integrated risk visualization tool to support risk-averse tour planning for backcountry skiing. Based on a high-resolution Digital Elevation Model (DEM), our visualization displays avalanche risk levels in real-time as a web-based 2.5D map application. Different static and dynamic avalanche risk layers are rendered on the Graphics Processing Unit (GPU) covering the alpine regions of Austria. By implementing a prototype application, we show that reduction methods can be evaluated in real-time based on existing data sources consisting of a Digital Elevation Model (DEM) and the per-region avalanche report for Austria. This evaluation allows us to visualize localized avalanche risk for a large area. To evaluate our prototype visualization, we conducted a pilot user study. The results of the study show that users have low trust in an integrated risk visualization when they are not familiar with the underlying risk reduction method. However, results also indicate that the combination of a 2.5D map with our integrated risk layer facilitates the identification of potential high-risk areas. We conclude that our work provides a foundation for an integrated risk avalanche risk visualization, however, further validation steps are still necessary.Additional Files and Images

Weblinks
BibTeX
@mastersthesis{eschner-2023-rar,
  title =      "Real-Time Avalanche Risk Visualization on a Large-Scale
               Geospatial Dataset",
  author =     "Johannes Eschner",
  year =       "2023",
  abstract =   "Every winter season reports of fatal avalanche accidents in
               the Alps are part of the news cycle. Data for tour planning
               with avalanche risk evaluation is available to
               recreationists in the form of daily avalanche reports and
               outdoor maps. These data are, however, distributed across
               different sources and have to be manually integrated by the
               end user to arrive at a risk value for a given tour. Risk
               reduction methods provide a framework for this integration
               process and thereby allow mountaineers to judge the overall
               risk and determine potential high-risk areas beforehand. We
               present an integrated risk visualization tool to support
               risk-averse tour planning for backcountry skiing. Based on a
               high-resolution Digital Elevation Model (DEM), our
               visualization displays avalanche risk levels in real-time as
               a web-based 2.5D map application. Different static and
               dynamic avalanche risk layers are rendered on the Graphics
               Processing Unit (GPU) covering the alpine regions of
               Austria. By implementing a prototype application, we show
               that reduction methods can be evaluated in real-time based
               on existing data sources consisting of a Digital Elevation
               Model (DEM) and the per-region avalanche report for Austria.
               This evaluation allows us to visualize localized avalanche
               risk for a large area. To evaluate our prototype
               visualization, we conducted a pilot user study. The results
               of the study show that users have low trust in an integrated
               risk visualization when they are not familiar with the
               underlying risk reduction method. However, results also
               indicate that the combination of a 2.5D map with our
               integrated risk layer facilitates the identification of
               potential high-risk areas. We conclude that our work
               provides a foundation for an integrated risk avalanche risk
               visualization, however, further validation steps are still
               necessary.",
  month =      jun,
  pages =      "114",
  address =    "Favoritenstrasse 9-11/E193-02, A-1040 Vienna, Austria",
  school =     "Research Unit of Computer Graphics, Institute of Visual
               Computing and Human-Centered Technology, Faculty of
               Informatics, TU Wien",
  keywords =   "risk visualization, real-time visualization, avalanche risk,
               terrain visualization, 2.5D mapping",
  URL =        "https://www.cg.tuwien.ac.at/research/publications/2023/eschner-2023-rar/",
}