

Maath Musleh , Angelos Chatzimparmpas, Ilir Jusufi
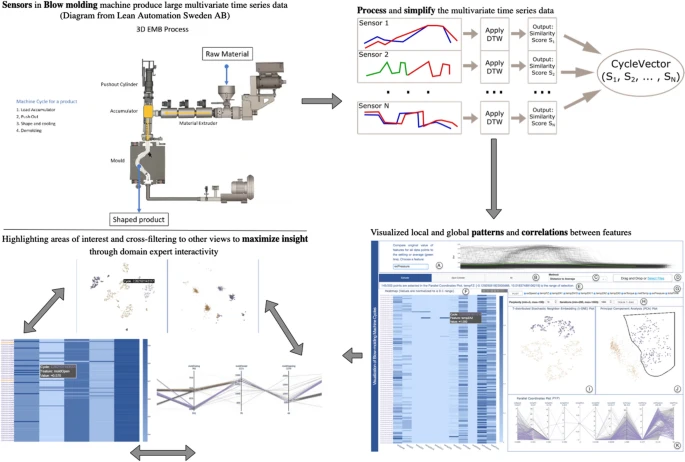
Visual analysis of blow molding machine multivariate time series data
Journal of Visualization, 25:1329-1342, July 2022. [ paper]
Information
- Publication Type: Journal Paper (without talk)
- Workgroup(s)/Project(s): not specified
- Date: July 2022
- DOI: 10.1007/s12650-022-00857-4
- ISSN: 1875-8975
- Journal: Journal of Visualization
- Open Access: yes
- Pages: 14
- Volume: 25
- Publisher: Springer
- Pages: 1329 – 1342
- Keywords: Time series data, Unsupervised machine learning, Visualization
Abstract
The recent development in the data analytics field provides a boost in production for modern industries. Small-sized factories intend to take full advantage of the data collected by sensors used in their machinery. The ultimate goal is to minimize cost and maximize quality, resulting in an increase in profit. In collaboration with domain experts, we implemented a data visualization tool to enable decision-makers in a plastic factory to improve their production process. The tool is an interactive dashboard with multiple coordinated views supporting the exploration from both local and global perspectives. In summary, we investigate three different aspects: methods for preprocessing multivariate time series data, clustering approaches for the already refined data, and visualization techniques that aid domain experts in gaining insights into the different stages of the production process. Here we present our ongoing results grounded in a human-centered development process. We adopt a formative evaluation approach to continuously upgrade our dashboard design that eventually meets partners’ requirements and follows the best practices within the field. We also conducted a case study with a domain expert to validate the potential application of the tool in the real-life context. Finally, we assessed the usability and usefulness of the tool with a two-layer summative evaluation that showed encouraging results.Additional Files and Images

Weblinks
- https://link.springer.com/article/10.1007/s12650-022-00857-4
- Entry in reposiTUm (TU Wien Publication Database)
- DOI: 10.1007/s12650-022-00857-4
BibTeX
@article{musleh-2022-mam5,
  title =      "Visual analysis of blow molding machine multivariate time
               series data",
  author =     "Maath Musleh and Angelos Chatzimparmpas and Ilir Jusufi",
  year =       "2022",
  abstract =   "The recent development in the data analytics field provides
               a boost in production for modern industries. Small-sized
               factories intend to take full advantage of the data
               collected by sensors used in their machinery. The ultimate
               goal is to minimize cost and maximize quality, resulting in
               an increase in profit. In collaboration with domain experts,
               we implemented a data visualization tool to enable
               decision-makers in a plastic factory to improve their
               production process. The tool is an interactive dashboard
               with multiple coordinated views supporting the exploration
               from both local and global perspectives. In summary, we
               investigate three different aspects: methods for
               preprocessing multivariate time series data, clustering
               approaches for the already refined data, and visualization
               techniques that aid domain experts in gaining insights into
               the different stages of the production process. Here we
               present our ongoing results grounded in a human-centered
               development process. We adopt a formative evaluation
               approach to continuously upgrade our dashboard design that
               eventually meets partners’ requirements and follows the
               best practices within the field. We also conducted a case
               study with a domain expert to validate the potential
               application of the tool in the real-life context. Finally,
               we assessed the usability and usefulness of the tool with a
               two-layer summative evaluation that showed encouraging
               results.",
  month =      jul,
  doi =        "10.1007/s12650-022-00857-4",
  issn =       "1875-8975",
  journal =    "Journal of Visualization",
  pages =      "14",
  volume =     "25",
  publisher =  "Springer",
  pages =      "1329--1342",
  keywords =   "Time series data, Unsupervised machine learning,
               Visualization",
  URL =        "https://www.cg.tuwien.ac.at/research/publications/2022/musleh-2022-mam5/",
}