

Manuel Eiweck
Immersive Exploration of Hierarchical Networks in VR
[ thesis] [video & tool]
Information
- Publication Type: Bachelor Thesis
- Workgroup(s)/Project(s):
- Date: April 2021
- Date (Start): September 2020
- Date (End): April 2021
- Matrikelnummer: 01633012
- First Supervisor: Manuela Waldner

- Second Supervisor: Johannes Sorger
Abstract
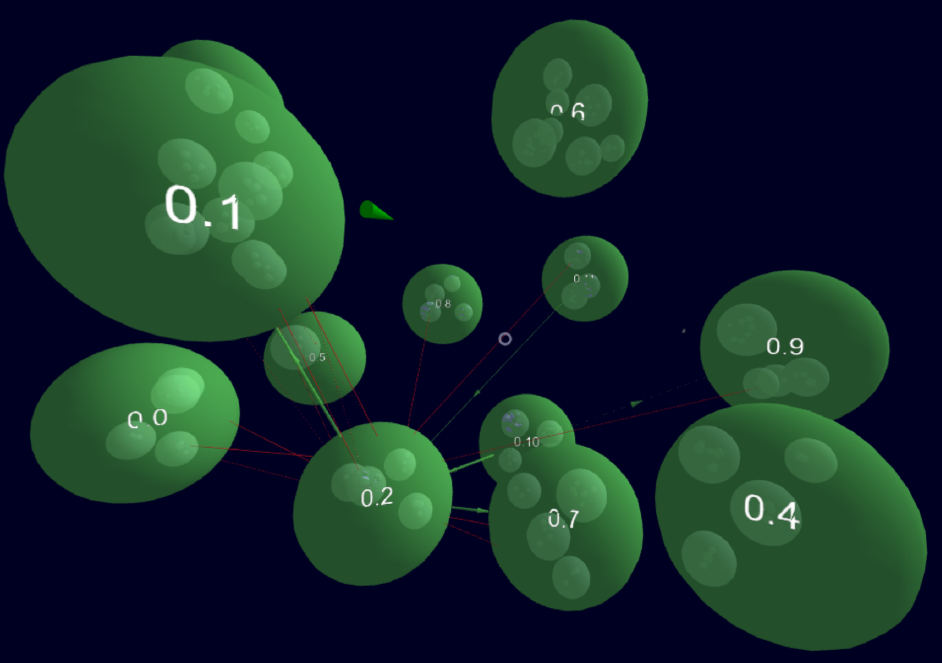
Our world is becoming more digital each year, new parts of our daily life become connected and the amount and complexity of the produced data increases steadily. The analysis of this data enables big opportunities for science and industry. A subset of this data is organized in the form of hierarchical networks or can be transformed by clustering algorithms into hierarchical layers. We see this in multiple application domains for example medical research where connections, group and cluster memberships of diseases are tracked; social science where relationships are mapped in company organization charts; in software engineering in the form of build-, dependency- and source code version management software with hierarchical connections between software modules, versions and layered software architecture.However, getting insight into this complex data with traditional two-dimensional visualization is getting more difficult as the visual clutter increases significantly with the exponentially growth of data we saw in recent years. Therefore, we need new methods and techniques to facilitate and expedite the analysis process. In this thesis, we investigate a new approach to visualize hierarchical network data by extending already existing concepts of two-dimensional hierarchical network visualizations with a third dimension and applying it to a virtual reality based visualization system. We believe that the capabilities of virtual reality devices, such as improved spatial impression and interaction possibilities by room-scale tracked headsets and controllers allow the visualization to fully utilize the benefits of three-dimensional information visualization. Therefore, it should be possible to analyze even bigger and more complex hierarchical networks than currently possible with conventional two-dimensional visualizations.
Additional Files and Images

Weblinks
BibTeX
@bachelorsthesis{eiweck-hnv-2021,
  title =      "Immersive Exploration of Hierarchical Networks in VR",
  author =     "Manuel Eiweck",
  year =       "2021",
  abstract =   "Our world is becoming more digital each year, new parts of
               our daily life become connected and the amount and
               complexity of the produced data increases steadily. The
               analysis of this data enables big opportunities for science
               and industry. A subset of this data is organized in the form
               of hierarchical networks or can be transformed by clustering
               algorithms into hierarchical layers. We see this in multiple
               application domains for example medical research where
               connections, group and cluster memberships of diseases are
               tracked; social science where relationships are mapped in
               company organization charts; in software engineering in the
               form of build-, dependency- and source code version
               management software with hierarchical connections between
               software modules, versions and layered software
               architecture.  However, getting insight into this complex
               data with traditional two-dimensional visualization is
               getting more difficult as the visual clutter increases
               significantly with the exponentially growth of data we saw
               in recent years. Therefore, we need new methods and
               techniques to facilitate and expedite the analysis process.
               In this thesis, we investigate a new approach to visualize
               hierarchical network data by extending already existing
               concepts of two-dimensional hierarchical network
               visualizations with a third dimension and applying it to a
               virtual reality based visualization system. We believe that
               the capabilities of virtual reality devices, such as
               improved spatial impression and interaction possibilities by
               room-scale tracked headsets and controllers allow the
               visualization to fully utilize the benefits of
               three-dimensional information visualization. Therefore, it
               should be possible to analyze even bigger and more complex
               hierarchical networks than currently possible with
               conventional two-dimensional visualizations.",
  month =      apr,
  address =    "Favoritenstrasse 9-11/E193-02, A-1040 Vienna, Austria",
  school =     "Research Unit of Computer Graphics, Institute of Visual
               Computing and Human-Centered Technology, Faculty of
               Informatics, TU Wien ",
  URL =        "https://www.cg.tuwien.ac.at/research/publications/2021/eiweck-hnv-2021/",
}