

Artem Amirkhanov, Christoph Heinzl, Christoph Kuhn, Johann Kastner, Eduard Gröller
Fuzzy CT Metrology: Dimensional Measurements on Uncertain Data
In SCCG 2013 - 29th Proceedings Spring conference on Computer Graphics, pages 93-101. May 2013.
[ paper] [
![]() presentation_with_materials] [
presentation_with_materials] [ video]
Information
- Publication Type: Conference Paper
- Workgroup(s)/Project(s): not specified
- Date: May 2013
- ISBN: 978-80-223-3377-1
- Publisher: Comenius university, Bratislava, Slovakia
- Location: Smolenice, Slovak Republic
- Lecturer: Artem Amirkhanov
- Booktitle: SCCG 2013 - 29th Proceedings Spring conference on Computer Graphics
- Conference date: 1. May 2013 – 3. May 2013
- Pages: 93 – 101
- Keywords: metrology, uncertainty visualization, level-of-details, industrial 3D computed tomography
Abstract
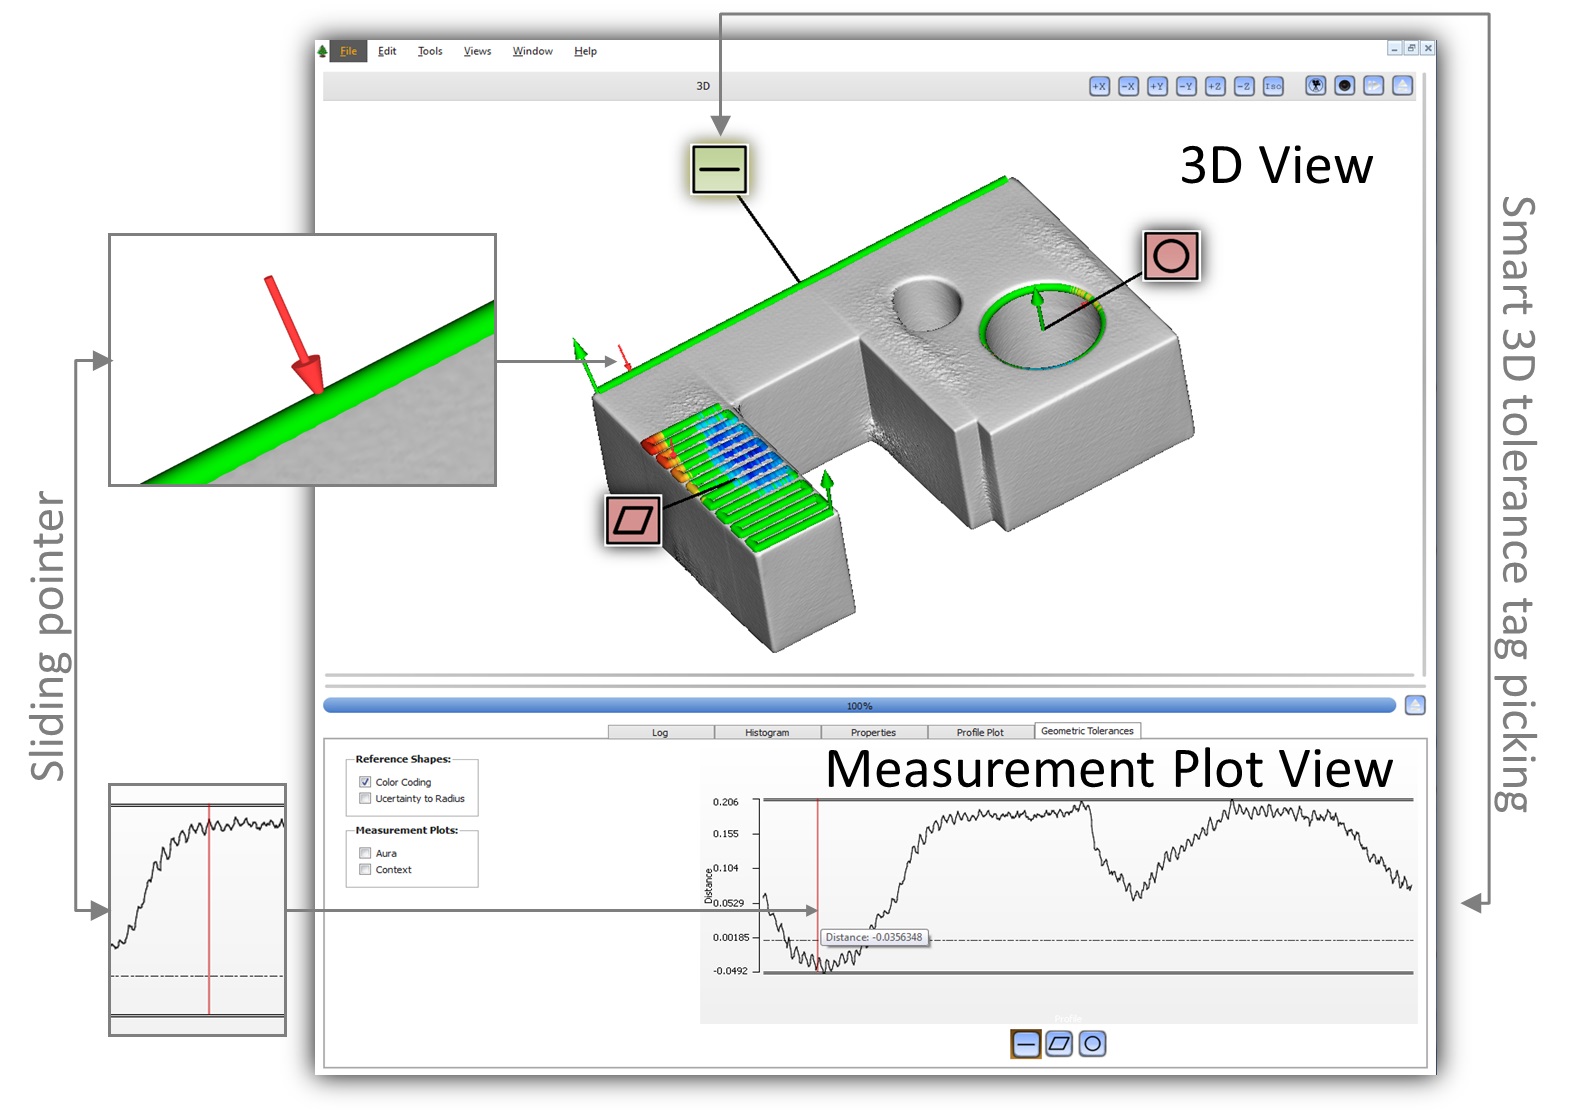
Metrology through geometric dimensioning and tolerancing is an important instrument applied for industrial manufacturing and quality control. Typically tactile or optical coordinate measurement machines (CMMs) are used to perform dimensional measurements. In recent years industrial 3D X-ray computed tomography (3DXCT) has been increasingly applied for metrology due to the development of XCT systems with higher accuracy and their ability to capture both internal and external structures of a specimen within one scan. Using 3DXCT the location of the specimen surface is estimated based on the scanned attenuation coefficients. As opposed to tactile or optical measurement techniques, the surface is not explicit and implies a certain positional uncertainty depending on artifacts and noise in the scan data and the used surface extraction algorithm. Moreover, conventional XCT measurement software does not consider uncertainty in the data. In this work we present techniques which account for uncertainty arising in the XCT metrology data flow. Our technique provides the domain experts with uncertainty visualizations, which extend the XCT metrology workflow on different levels. The developed techniques are integrated into a tool utilizing linked views, smart 3D tolerance tagging and plotting functionalities. The presented system is capable of visualizing the uncertainty of measurements on various levels-of-detail. Commonly known geometric tolerance indications are provided as smart tolerance tags. Finally, we incorporate the uncertainty of the data as a context in commonly used measurement plots. The proposed techniques provide an augmented insight into the reliability of geometric tolerances while maintaining the daily workflow of domain specialists, giving the user additional information on the nature of areas with high uncertainty. The presented techniques are evaluated based on domain experts feedback in collaboration with our company partners.Additional Files and Images
Additional images and videos
Additional files


Weblinks
No further information available.BibTeX
@inproceedings{amirkhanov_2013_AMA,
  title =      "Fuzzy CT Metrology: Dimensional Measurements on Uncertain
               Data",
  author =     "Artem Amirkhanov and Christoph Heinzl and Christoph Kuhn and
               Johann Kastner and Eduard Gr\"{o}ller",
  year =       "2013",
  abstract =   "Metrology through geometric dimensioning and tolerancing is
               an important instrument applied for industrial manufacturing
               and quality control. Typically tactile or optical coordinate
               measurement machines (CMMs) are used to perform dimensional
               measurements. In recent years industrial 3D X-ray computed
               tomography (3DXCT) has been increasingly applied for
               metrology due to the development of XCT systems with higher
               accuracy and their ability to capture both internal and
               external structures of a specimen within one scan. Using
               3DXCT the location of the specimen surface is estimated
               based on the scanned attenuation coefficients. As opposed to
               tactile or optical measurement techniques, the surface is
               not explicit and implies a certain positional uncertainty
               depending on artifacts and noise in the scan data and the
               used surface extraction algorithm. Moreover, conventional
               XCT measurement software does not consider uncertainty in
               the data. In this work we present techniques which account
               for uncertainty arising in the XCT metrology data flow. Our
               technique provides the domain experts with uncertainty
               visualizations, which extend the XCT metrology workflow on
               different levels. The developed techniques are integrated
               into a tool utilizing linked views, smart 3D tolerance
               tagging and plotting functionalities. The presented system
               is capable of visualizing the uncertainty of measurements on
               various levels-of-detail. Commonly known geometric tolerance
               indications are provided as smart tolerance tags. Finally,
               we incorporate the uncertainty of the data as a context in
               commonly used measurement plots. The proposed techniques
               provide an augmented insight into the reliability of
               geometric tolerances while maintaining the daily workflow of
               domain specialists, giving the user additional information
               on the nature of areas with high uncertainty. The presented
               techniques are evaluated based on domain experts feedback in
               collaboration with our company partners.",
  month =      may,
  isbn =       "978-80-223-3377-1",
  publisher =  "Comenius university, Bratislava, Slovakia",
  location =   "Smolenice, Slovak Republic",
  booktitle =  "SCCG 2013 - 29th Proceedings Spring conference on Computer
               Graphics",
  pages =      "93--101",
  keywords =   "metrology, uncertainty visualization, level-of-details,
               industrial 3D computed tomography",
  URL =        "https://www.cg.tuwien.ac.at/research/publications/2013/amirkhanov_2013_AMA/",
}