

Jean-Paul Balabanian, Ivan Viola , Eduard Gröller
Interactive Illustrative Visualization of Hierarchical Volume Data
In Proceedings of Graphics Interface 2010, pages 137-144. June 2010.
[ Paper]
Information
- Publication Type: Conference Paper
- Workgroup(s)/Project(s):
- Date: June 2010
- Location: Ottawa, Ontario, Canada
- Lecturer: Jean-Paul Balabanian
- Booktitle: Proceedings of Graphics Interface 2010
- Conference date: 31. May 2010 – 2. June 2010
- Pages: 137 – 144
- Keywords: visualization, volume data, hierarchical
Abstract
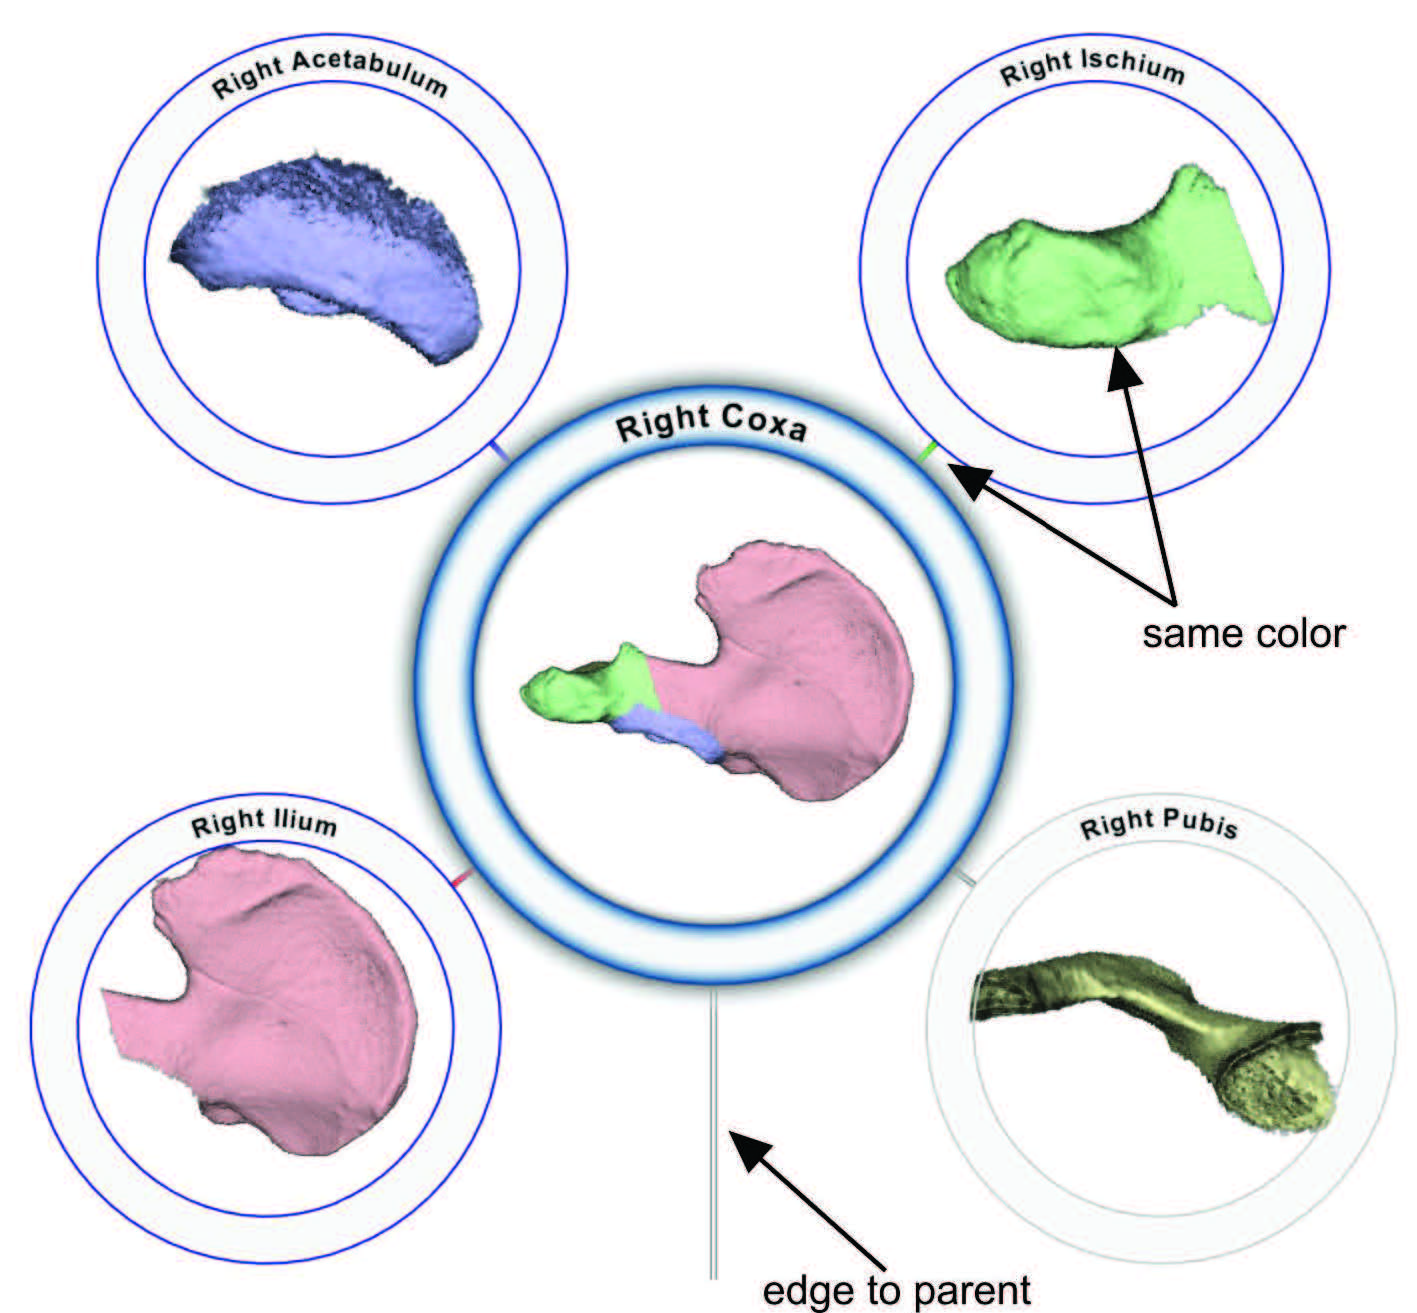
In scientific visualization the underlying data often has an inherent abstract and hierarchical structure. Therefore, the same dataset can simultaneously be studied with respect to its characteristics in the three-dimensional space and in the hierarchy space. Often both characteristics are equally important to convey. For such scenarios we explore the combination of hierarchy visualization and scientific visualization, where both data spaces are effectively integrated. We have been inspired by illustrations of species evolutions where hierarchical information is often present. Motivated by these traditional illustrations, we introduce integrated visualizations for hierarchically organized volumetric datasets. The hierarchy data is displayed as a graph, whose nodes are visually augmented to depict the corresponding 3D information. These augmentations include images due to volume raycasting, slicing of 3D structures, and indicators of structure visibility from occlusion testing. New interaction metaphors are presented that extend visualizations and interactions, typical for one visualization space, to control visualization parameters of the other space. Interaction on a node in the hierarchy influences visual representations of 3D structures and vice versa. We integrate both the abstract and the scientific visualizations into one view which avoids frequent refocusing typical for interaction with linked-view layouts. We demonstrate our approach on different volumetric datasets enhanced with hierarchical information.Additional Files and Images

Weblinks
No further information available.BibTeX
@inproceedings{Balabanian-2010-IIV,
  title =      "Interactive Illustrative Visualization of Hierarchical
               Volume Data",
  author =     "Jean-Paul Balabanian and Ivan Viola and Eduard Gr\"{o}ller",
  year =       "2010",
  abstract =   "In scientific visualization the underlying data often has an
               inherent abstract and hierarchical structure. Therefore, the
               same dataset can simultaneously be studied with respect to
               its characteristics in the three-dimensional space and in
               the hierarchy space. Often both characteristics are equally
               important to convey. For such scenarios we explore the
               combination of hierarchy visualization and scientific
               visualization, where both data spaces are effectively
               integrated. We have been inspired by illustrations of
               species evolutions where hierarchical information is often
               present. Motivated by these traditional illustrations, we
               introduce integrated visualizations for hierarchically
               organized volumetric datasets. The hierarchy data is
               displayed as a graph, whose nodes are visually augmented to
               depict the corresponding 3D information. These augmentations
               include images due to volume raycasting, slicing of 3D
               structures, and indicators of structure visibility from
               occlusion testing. New interaction metaphors are presented
               that extend visualizations and interactions, typical for one
               visualization space, to control visualization parameters of
               the other space. Interaction on a node in the hierarchy
               influences visual representations of 3D structures and vice
               versa. We integrate both the abstract and the scientific
               visualizations into one view which avoids frequent
               refocusing typical for interaction with linked-view layouts.
               We demonstrate our approach on different volumetric datasets
               enhanced with hierarchical information.",
  month =      jun,
  location =   "Ottawa, Ontario, Canada",
  booktitle =  "Proceedings of Graphics Interface 2010",
  pages =      "137--144",
  keywords =   "visualization, volume data, hierarchical",
  URL =        "https://www.cg.tuwien.ac.at/research/publications/2010/Balabanian-2010-IIV/",
}