

Muhammad Muddassir Malik
Feature Centric Volume Visualization
Supervisor: Eduard Gröller
Duration: December 2005 — December 2009
[ Thesis]
Information
- Publication Type: PhD-Thesis
- Workgroup(s)/Project(s):
- Date: December 2009
- Date (Start): December 2005
- Date (End): December 2009
- TU Wien Library:
- Open Access: yes
- 2nd Reviewer: Ivan Viola
- Rigorosum: 11. December 2009
- First Supervisor: Eduard Gröller
- Pages: 105
- Keywords: marching cubes, feature peeling, difference measurement, multiple datasets, parameter visualization, comparative visualization, industrial computed tomography, volume visualization, fabrication artifacts, magnetic resonance imaging
Abstract
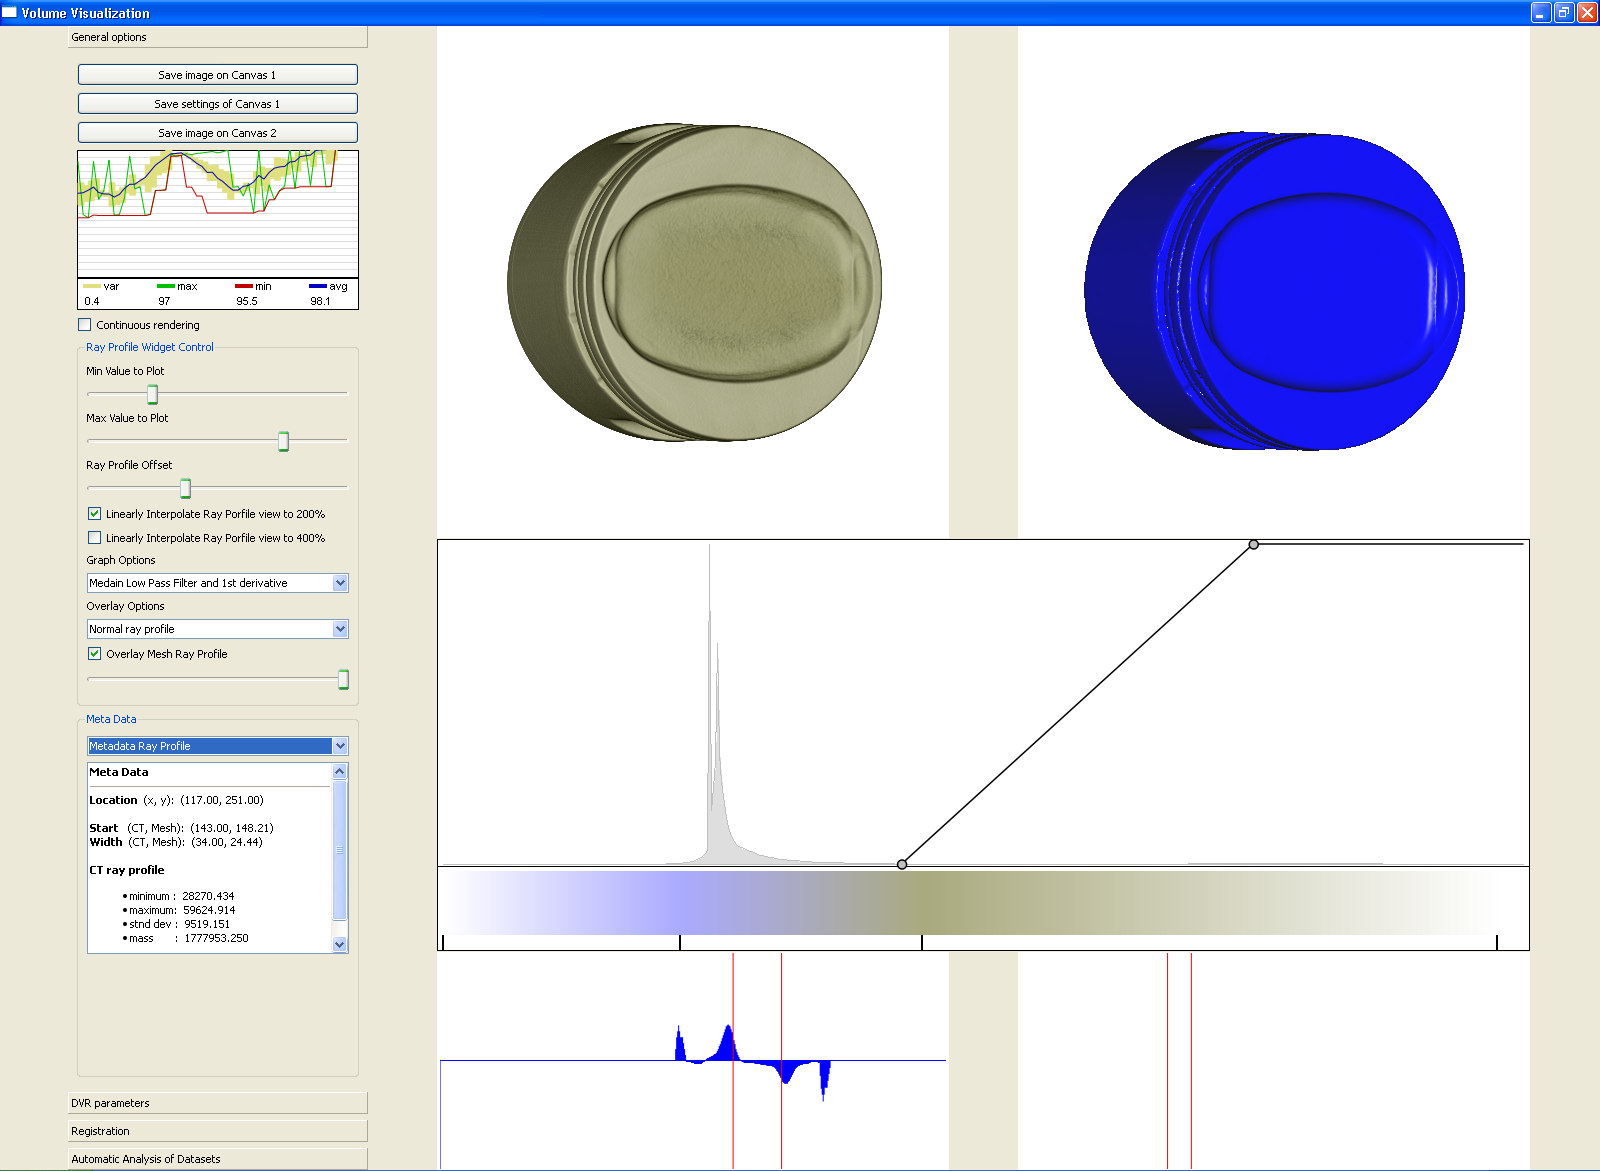
This thesis presents techniques and algorithms for the effective exploration of volumetric datasets. The Visualization techniques are designed to focus on user specified features of interest. The proposed techniques are grouped into four chapters namely feature peeling, computation and visualization of fabrication artifacts, locally adaptive marching cubes, and comparative visualization for parameter studies of dataset series. The presented methods enable the user to efficiently explore the volumetric dataset for features of interest.Feature peeling is a novel rendering algorithm that analyzes ray profiles along lines of sight. The profiles are subdivided according to encountered peaks and valleys at so called transition points. The sensitivity of these transition points is calibrated via two thresholds. The slope threshold is based on the magnitude of a peak following a valley, while the peeling threshold measures the depth of the transition point relative to the neighboring rays. This technique separates the dataset into a number of feature layers.
Fabrication artifacts are of prime importance for quality control engineers for first part inspection of industrial components. Techniques are presented in this thesis to measure fabrication artifacts through direct comparison of a reference CAD model with the corresponding industrial 3D X-ray computed tomography volume. Information from the CAD model is used to locate corresponding points in the volume data. Then various comparison metrics are computed to measure differences (fabrication artifacts) between the CAD model and the volumetric dataset. The comparison metrics are classified as either geometry-driven comparison techniques or visual-driven comparison techniques.
The locally adaptive marching cubes algorithm is a modification of the marching cubes algorithm where instead of a global iso-value, each grid point has its own iso-value. This defines an iso-value field, which modifies the case identification process in the algorithm. An iso-value field enables the algorithm to correct biases within the dataset like low frequency noise, contrast drifts, local density variations, and other artifacts introduced by the measurement process. It can also be used for blending between different iso-surfaces (e.g., skin, and bone in a medical dataset).
Comparative visualization techniques are proposed to carry out parameter studies for the special application area of dimensional measurement using industrial 3D X-ray computed tomography. A dataset series is generated by scanning a specimen multiple times by varying parameters of the scanning device. A high resolution series is explored using a planar reformatting based visualization system. A multi-image view and an edge explorer are proposed for comparing and visualizing gray values and edges of several datasets simultaneously. For fast data retrieval and convenient usability the datasets are bricked and efficient data structures are used.
Additional Files and Images
Additional images and videos

Additional files


Weblinks
BibTeX
@phdthesis{malik-thesis,
  title =      "Feature Centric Volume Visualization",
  author =     "Muhammad Muddassir Malik",
  year =       "2009",
  abstract =   "This thesis presents techniques and algorithms for the
               effective exploration of volumetric datasets. The
               Visualization techniques are designed to focus on user
               specified features of interest. The proposed techniques are
               grouped into four chapters namely feature peeling,
               computation and visualization of fabrication artifacts,
               locally adaptive marching cubes, and comparative
               visualization for parameter studies of dataset series. The
               presented methods enable the user to efficiently explore the
               volumetric dataset for features of interest.  Feature
               peeling is a novel rendering algorithm that analyzes ray
               profiles along lines of sight. The profiles are subdivided
               according to encountered peaks and valleys at so called
               transition points. The sensitivity of these transition
               points is calibrated via two thresholds. The slope threshold
               is based on the magnitude of a peak following a valley,
               while the peeling threshold measures the depth of the
               transition point relative to the neighboring rays. This
               technique separates the dataset into a number of feature
               layers.  Fabrication artifacts are of prime importance for
               quality control engineers for first part inspection of
               industrial components. Techniques are presented in this
               thesis to measure fabrication artifacts through direct
               comparison of a reference CAD model with the corresponding
               industrial 3D X-ray computed tomography volume. Information
               from the CAD model is used to locate corresponding points in
               the volume data. Then various comparison metrics are
               computed to measure differences (fabrication artifacts)
               between the CAD model and the volumetric dataset. The
               comparison metrics are classified as either geometry-driven
               comparison techniques or visual-driven comparison
               techniques.  The locally adaptive marching cubes algorithm
               is a modification of the marching cubes algorithm where
               instead of a global iso-value, each grid point has its own
               iso-value. This defines an iso-value field, which modifies
               the case identification process in the algorithm. An
               iso-value field enables the algorithm to correct biases
               within the dataset like low frequency noise, contrast
               drifts, local density variations, and other artifacts
               introduced by the measurement process. It can also be used
               for blending between different iso-surfaces (e.g., skin, and
               bone in a medical dataset).  Comparative visualization
               techniques are proposed to carry out parameter studies for
               the special application area of dimensional measurement
               using industrial 3D X-ray computed tomography. A dataset
               series is generated by scanning a specimen multiple times by
               varying parameters of the scanning device. A high resolution
               series is explored using a planar reformatting based
               visualization system. A multi-image view and an edge
               explorer are proposed for comparing and visualizing gray
               values and edges of several datasets simultaneously. For
               fast data retrieval and convenient usability the datasets
               are bricked and efficient data structures are used.",
  month =      dec,
  pages =      "105",
  address =    "Favoritenstrasse 9-11/E193-02, A-1040 Vienna, Austria",
  school =     "Institute of Computer Graphics and Algorithms, Vienna
               University of Technology ",
  keywords =   "marching cubes, feature peeling, difference measurement,
               multiple datasets, parameter visualization, comparative
               visualization, industrial computed tomography, volume
               visualization, fabrication artifacts, magnetic resonance
               imaging",
  URL =        "https://www.cg.tuwien.ac.at/research/publications/2009/malik-thesis/",
}