

 DAEV
DAEV poster
 Thesis
 vcd-paper
Information
- Publication Type: Master Thesis
- Workgroup(s)/Project(s):
- Date: October 2008
- TU Wien Library:
- Diploma Examination: 27. October 2008
- First Supervisor:

Abstract
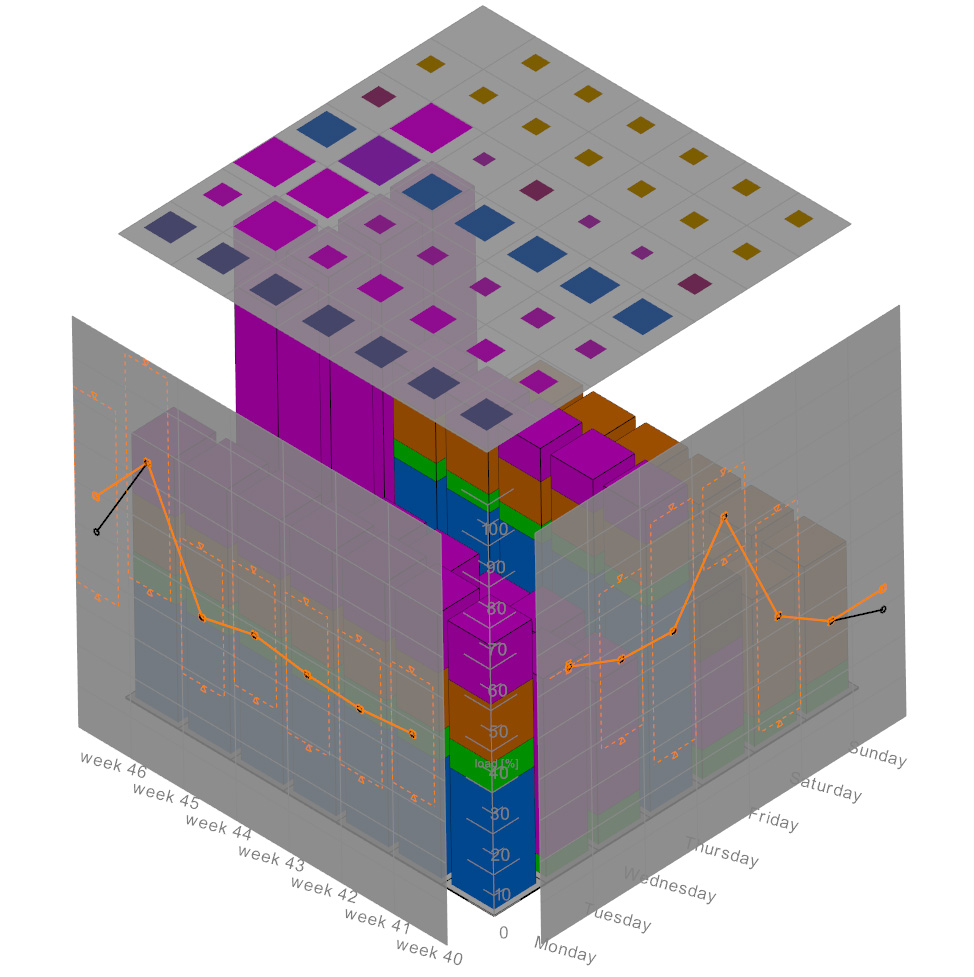
Since many centuries, calendars are used to organize appointments, events and tasks. In this thesis interaction and visualization techniques for calendar data are presented, which do not only support the organization and analysis, but also facilitate and improve them. The basis of the solution is a 3D heightfield visualization, which displays the workloads of time slots over periods of time in a compact manner. Thereon, interaction and visualization techniques are used to investigate the data set for regularities and irregularities. The comparison of data sets while planning events is just as important as the integration of fuzzy tasks into one’s schedule and their manipulation. The visualization and exploration process is completed by statistical representations showing trends and patterns. The use of these techniques and the combination of them are presented with the help of real examples.Additional Files and Images


Weblinks
No further information available.BibTeX
@mastersthesis{hartl-2008-vcd,
  title =      "Visualization of Calendar Data",
  author =     "Philipp Hartl",
  year =       "2008",
  abstract =   "Since many centuries, calendars are used to organize
               appointments, events and tasks. In this thesis interaction
               and visualization techniques for calendar data are
               presented, which do not only support the organization and
               analysis, but also facilitate and improve them. The basis of
               the solution is a 3D heightfield visualization, which
               displays the workloads of time slots over periods of time in
               a compact manner. Thereon, interaction and visualization
               techniques are used to investigate the data set for
               regularities and irregularities. The comparison of data sets
               while planning events is just as important as the
               integration of fuzzy tasks into one’s schedule and their
               manipulation. The visualization and exploration process is
               completed by statistical representations showing trends and
               patterns. The use of these techniques and the combination of
               them are presented with the help of real examples.",
  month =      oct,
  address =    "Favoritenstrasse 9-11/E193-02, A-1040 Vienna, Austria",
  school =     "Institute of Computer Graphics and Algorithms, Vienna
               University of Technology ",
  URL =        "https://www.cg.tuwien.ac.at/research/publications/2008/hartl-2008-vcd/",
}