


Information
- Publication Type: Miscellaneous Publication
- Workgroup(s)/Project(s):
- Date: 2007
Abstract
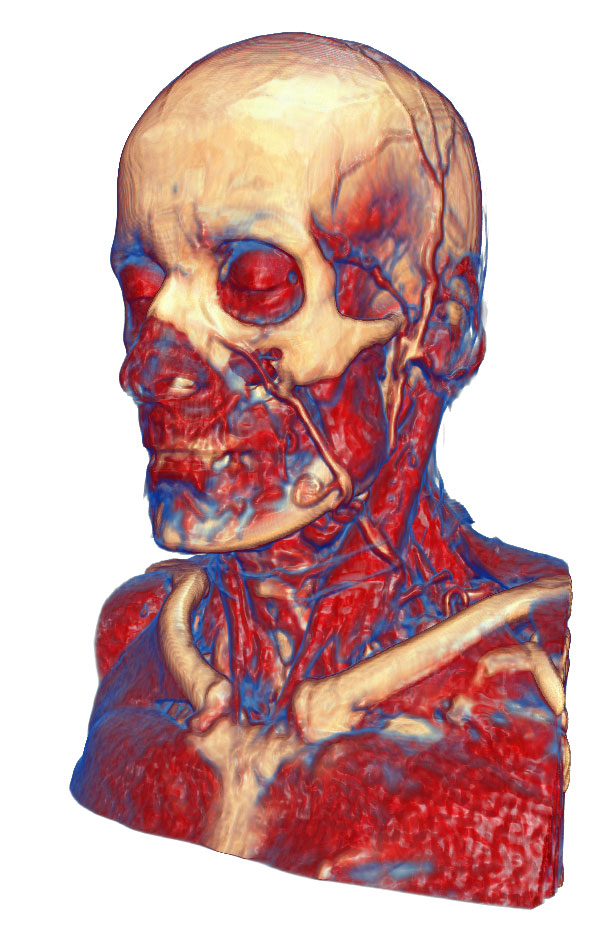
The area of illustrative visualization is concerned with developing methods to enhance the depiction of scientific data based on principles founded in traditional illustration. The illustration community has century-long experience in adapting their techniques to human perceptual needs in order to generate an effective depiction which conveys the desired message. Thus, their methods can provide us with important insights into visualization problems. In this tutorial, the concepts in illustrative visualization are reviewed. An important aspect here is interaction: while traditional illustrations are commonly only presented as static images, computer-assisted visualization enables interactive exploration and manipulation of complex scientific data. Only by coupling illustrative visualization with effective interaction techniques its full potential can be exploited. The tutorial starts with a general introduction into the area of illustrative visualization. The concept of importance-driven visualization and its applications are presented. Then we proceed with a discussion how traditional abstraction techniques can be applied in an interactive context using importance-based methods. This ranges from low-level appearance to smart viewpoint-dependent visibility techniques such as cutaways or exploded views. Further advanced manipulation strategies are discussed in the third part. The use deformations to enhance visibility of certain features while providing context or to abstract the structure of a complex objects through direct interaction with the data is examined. As many of the presented methods rely on a separation of focus and context, i.e., the important structures in the data have been identified, the tutorial discusses approaches for selecting objects of interest in a three-dimensional environment using intuitive sketch-based interfaces. Since the effectiveness of a user-interface is heavily dependent on the previous knowledge of the user, the last part of the tutorial examines the concept of layering interfaces based on user expertise. Finally, the application of illustrative display and interaction techniques for non-traditional modalities such as mobile devices concludes the tutorial.IEEE Visualization 2007 Tutorial Page: http://vis.computer.org/vis2007/session/tutorials.html#t7
See also previous tutorials on Illustrative Visualization:
IEEE Visualization 2006 Tutorial on Illustrative Visualization for Science and Medicine http://www.cg.tuwien.ac.at/research/publications/2006/tut-vis-2006/
Eurographics 2006 Tutorial on Illustrative Visualization for Science and Medicine http://www.cg.tuwien.ac.at/research/publications/2006/tut-eg-2006/
SIGGRAPH 2006 Course on Illustrative Visualization for Science and Medicine http://www.cg.tuwien.ac.at/research/publications/2006/tut-siggraph-2006/
IEEE Visualization 2005 Tutorial on Illustrative Visualization http://www.cg.tuwien.ac.at/research/publications/2005/Viola-vistutillustrativevis/
Eurographics 2005 Tutorial on Illustrative Visualization http://www.cg.tuwien.ac.at/research/publications/2005/eg-tut2005-iv/
Additional Files and Images
Weblinks
No further information available.BibTeX
@misc{tut-vis-2007,
  title =      "IEEE Visualization Tutorial on Illustrative Display and
               Interaction in Visualization",
  author =     "Ivan Viola and Stefan Bruckner and Mario Costa Sousa and
               David Ebert and Carlos Correa",
  year =       "2007",
  abstract =   "The area of illustrative visualization is concerned with
               developing methods to enhance the depiction of scientific
               data based on principles founded in traditional
               illustration. The illustration community has century-long
               experience in adapting their techniques to human perceptual
               needs in order to generate an effective depiction which
               conveys the desired message. Thus, their methods can provide
               us with important insights into visualization problems. In
               this tutorial, the concepts in illustrative visualization
               are reviewed. An important aspect here is interaction: while
               traditional illustrations are commonly only presented as
               static images, computer-assisted visualization enables
               interactive exploration and manipulation of complex
               scientific data. Only by coupling illustrative visualization
               with effective interaction techniques its full potential can
               be exploited. The tutorial starts with a general
               introduction into the area of illustrative visualization.
               The concept of importance-driven visualization and its
               applications are presented. Then we proceed with a
               discussion how traditional abstraction techniques can be
               applied in an interactive context using importance-based
               methods. This ranges from low-level appearance to smart
               viewpoint-dependent visibility techniques such as cutaways
               or exploded views. Further advanced manipulation strategies
               are discussed in the third part. The use deformations to
               enhance visibility of certain features while providing
               context or to abstract the structure of a complex objects
               through direct interaction with the data is examined. As
               many of the presented methods rely on a separation of focus
               and context, i.e., the important structures in the data have
               been identified, the tutorial discusses approaches for
               selecting objects of interest in a three-dimensional
               environment using intuitive sketch-based interfaces. Since
               the effectiveness of a user-interface is heavily dependent
               on the previous knowledge of the user, the last part of the
               tutorial examines the concept of layering interfaces based
               on user expertise. Finally, the application of illustrative
               display and interaction techniques for non-traditional
               modalities such as mobile devices concludes the tutorial.
               IEEE Visualization 2007 Tutorial Page:
               http://vis.computer.org/vis2007/session/tutorials.html#t7
               See also previous tutorials on Illustrative Visualization:
               IEEE Visualization 2006 Tutorial on Illustrative
               Visualization for Science and Medicine
               http://www.cg.tuwien.ac.at/research/publications/2006/tut-vis-2006/
                Eurographics 2006 Tutorial on Illustrative Visualization
               for Science and Medicine
               http://www.cg.tuwien.ac.at/research/publications/2006/tut-eg-2006/
                SIGGRAPH 2006 Course on Illustrative Visualization for
               Science and Medicine
               http://www.cg.tuwien.ac.at/research/publications/2006/tut-siggraph-2006/
                IEEE Visualization 2005 Tutorial on Illustrative
               Visualization
               http://www.cg.tuwien.ac.at/research/publications/2005/Viola-vistutillustrativevis/
                Eurographics 2005 Tutorial on Illustrative Visualization
               http://www.cg.tuwien.ac.at/research/publications/2005/eg-tut2005-iv/
                ",
  URL =        "https://www.cg.tuwien.ac.at/research/publications/2007/tut-vis-2007/",
}