

Raphael Bürger, Helwig Hauser
Visualization of Multi-variate Scientific Data
In EuroGraphics 2007 State of the Art Reports (STARs), pages 117-134. 2007.
[ Paper] [
![]() Slides (Updated)]
Slides (Updated)]
Information
- Publication Type: Conference Paper
- Workgroup(s)/Project(s):
- Date: 2007
- ISBN: 1017-4656
- Lecturer: Raphael Fuchs
- Booktitle: EuroGraphics 2007 State of the Art Reports (STARs)
- Pages: 117 – 134
- Keywords: scientific data, multi-variate data
Abstract
In this state-of-the-art report we discuss relevant research works related to the visualization of complex, multi-variate data. We focus on ''non-classical'' approaches, i.e. approaches which haven't been discussed in previous related reports, and we highlight techniques which potentially lead towards new directions in visualization research. We discuss how different techniques take effect at specific stages of the visualization pipeline and how they apply to multi-variate data sets being composed of scalars, vectors, and tensors. We also provide a categorization of these techniques in the aim for a better overview of related approaches. In the second part of this paper we take a look at recent techniques that are useful for the visualization of complex data sets either because they are general purpose or because they can be adapted to specific problems.Additional Files and Images
Additional images and videos
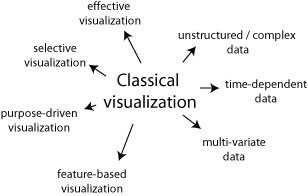
Figure1:
Visualization research is developing from classical 3D structured scalar visualization. the use of techniques that allow the visualization of time-dependent, complex and multi-variate data in a useful way will be a key to successful visualization applications in the future.
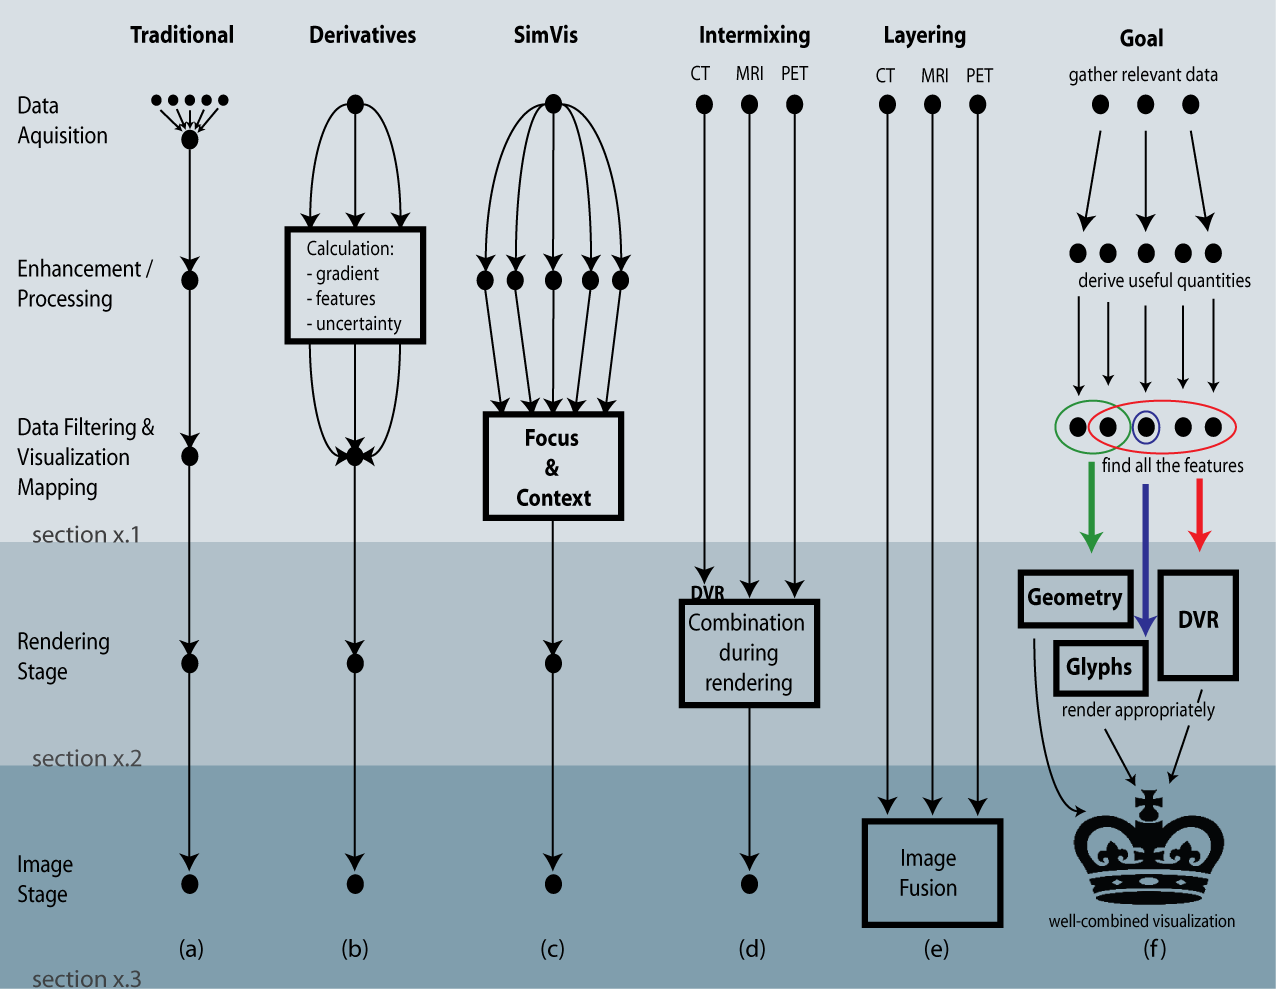 Figure2:
Six examples of how to deal with multi-dimensional data-sets: (a) traditional (b) deriving additional quantities (c) linking brushing and other SimVis related techniques (d) data intermixing (e) layering rendered images (f) a well-combined visualization technique using all relevant data and derivations.
Figure2:
Six examples of how to deal with multi-dimensional data-sets: (a) traditional (b) deriving additional quantities (c) linking brushing and other SimVis related techniques (d) data intermixing (e) layering rendered images (f) a well-combined visualization technique using all relevant data and derivations.
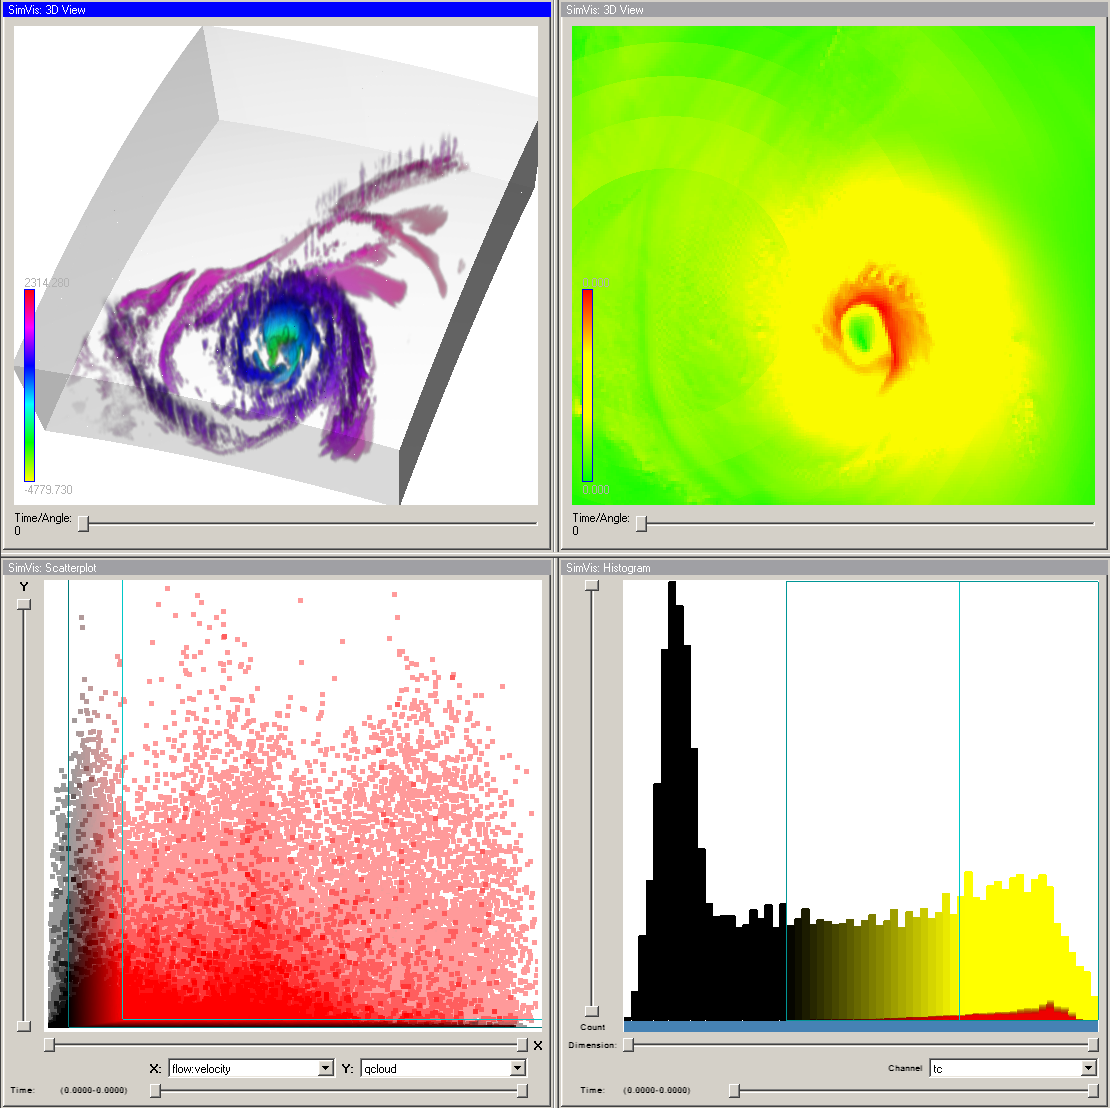 Figure3:
An example of combined attribute and volumetric views. The 3D view shows the location of data points in space with pressure mapped to color. A 2D slice shows the velocity close to the eye of the storm. Two attribute views (scatterplot of velocity vs. cloud density and histogramm of temperature) are used to select which cells are shown.
Figure3:
An example of combined attribute and volumetric views. The 3D view shows the location of data points in space with pressure mapped to color. A 2D slice shows the velocity close to the eye of the storm. Two attribute views (scatterplot of velocity vs. cloud density and histogramm of temperature) are used to select which cells are shown.
Additional files

Weblinks
No further information available.BibTeX
@inproceedings{buerger-2007-star,
  title =      "Visualization of Multi-variate Scientific Data",
  author =     "Raphael B\"{u}rger and Helwig Hauser",
  year =       "2007",
  abstract =   "In this state-of-the-art report we discuss relevant research
               works related to the visualization of complex, multi-variate
               data. We focus on ''non-classical'' approaches, i.e.
               approaches which haven't been discussed in previous related
               reports, and we highlight techniques which potentially lead
               towards new directions in visualization research. We discuss
               how different techniques take effect at specific stages of
               the visualization pipeline and how they apply to
               multi-variate data sets being composed of scalars, vectors,
               and tensors. We  also provide a categorization of these
               techniques in the aim for a better  overview of related
               approaches. In the second part of this paper we take a  look
               at recent techniques that are useful for the visualization
               of complex data  sets either because they are general
               purpose or because they can be adapted to specific
               problems.",
  isbn =       "1017-4656",
  booktitle =  "EuroGraphics 2007 State of the Art Reports (STARs)",
  pages =      "117--134",
  keywords =   "scientific data, multi-variate data",
  URL =        "https://www.cg.tuwien.ac.at/research/publications/2007/buerger-2007-star/",
}