

Image
Publication
This image has been taken from the following publication:| 2008 | ||
 |
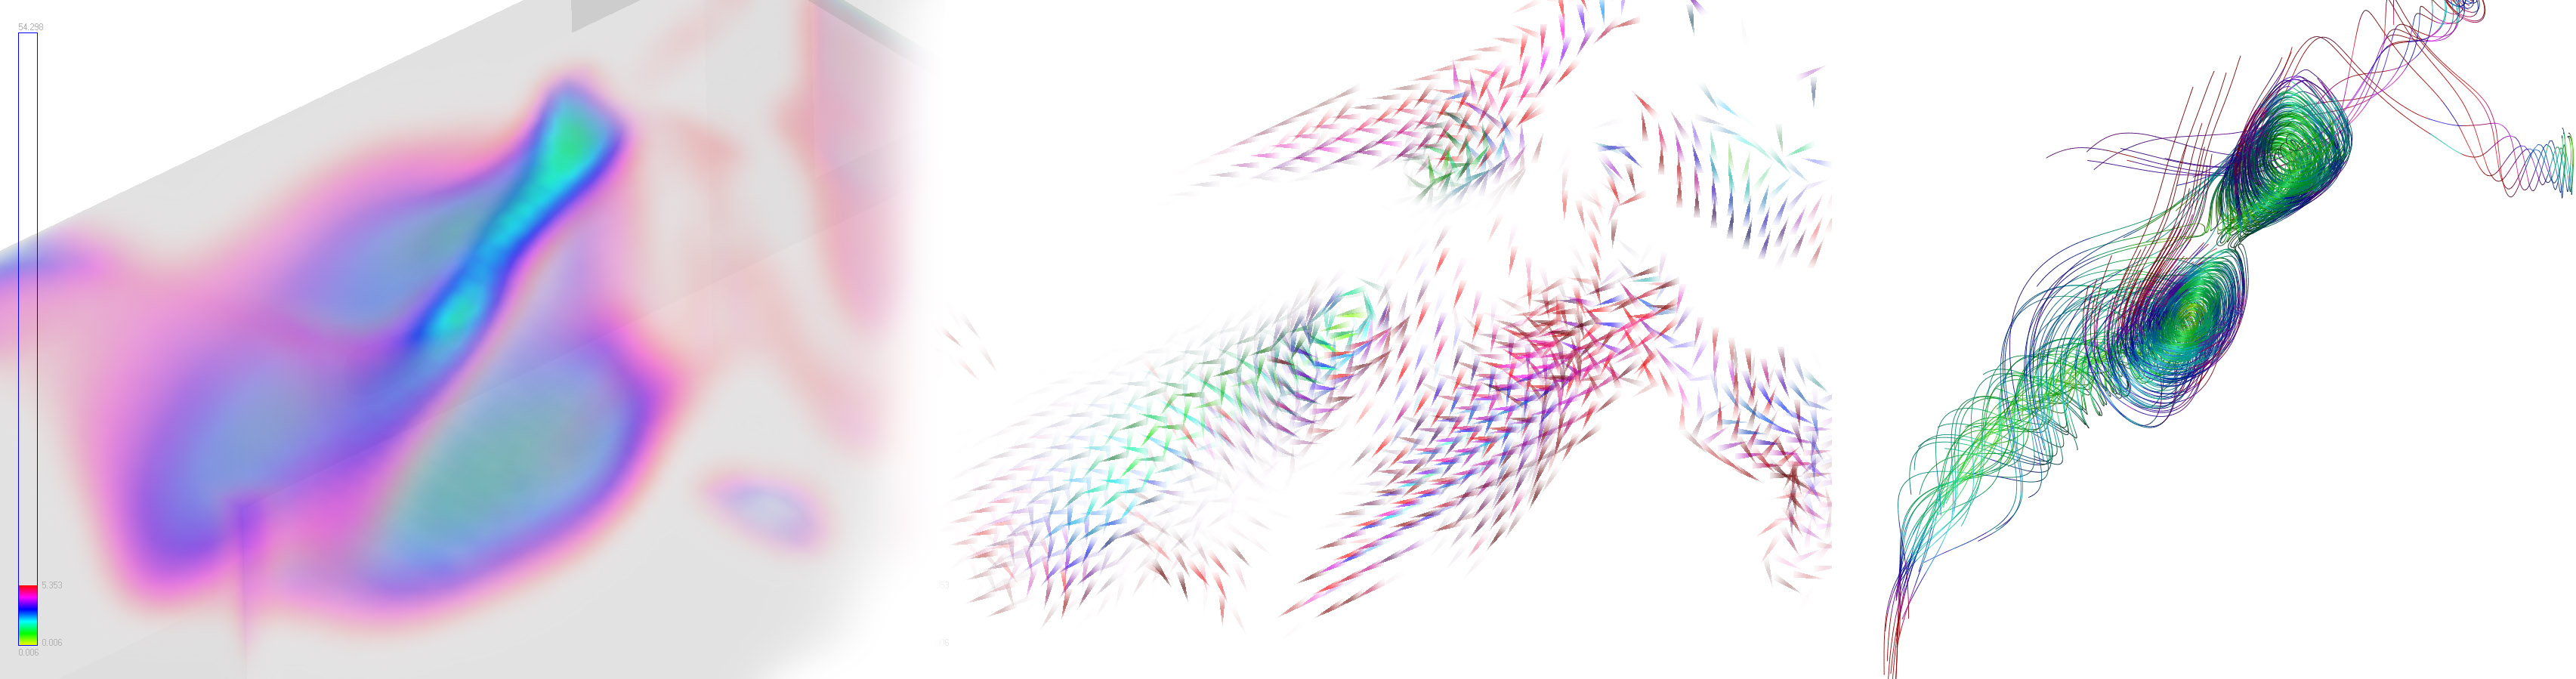
Martin Ilčík A Semi-Global Approach to Interactive Visual Analysis of Multivariate Flow Simulation Data Computer Graphics & Geometry, 10(3):18-35, 2008. [ 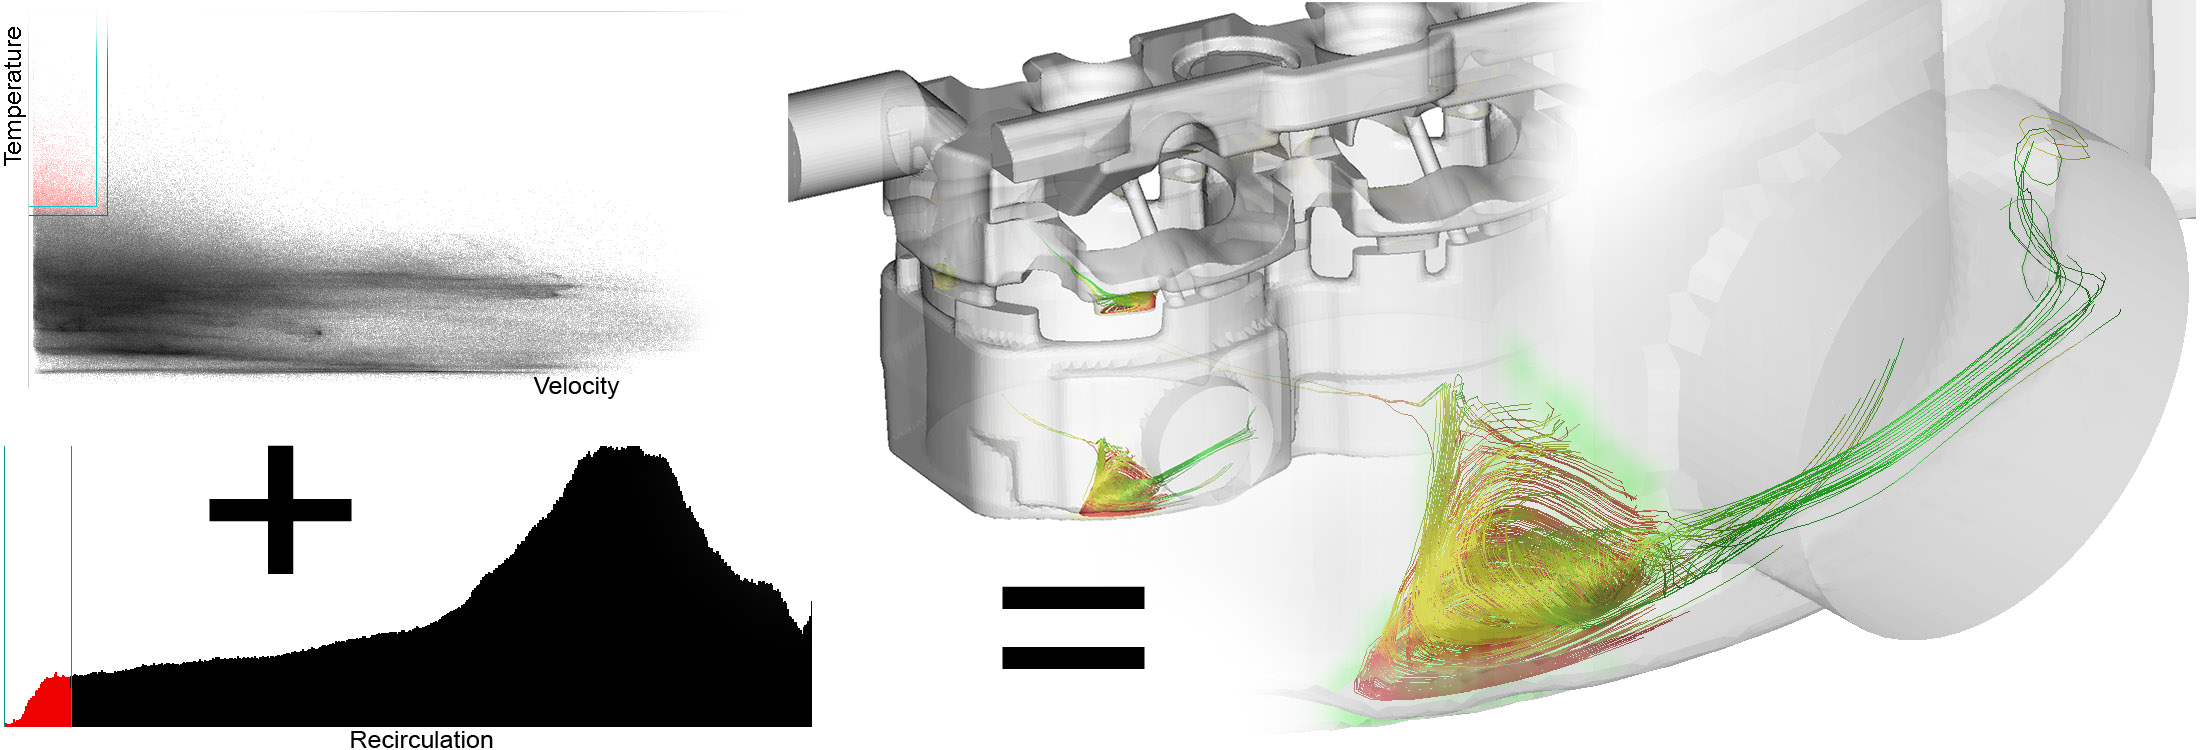 teaserimage] teaserimage] |
Journal Paper (without talk) |