BiSet Visualization Demo
This is an implementation of BiSet using D3.js. BiSet visualization was proposed by Sun et al. and aids in the discovery of coordinated relationships in nominal, relational data.1
1: Sun, Maoyuan, et al. "Biset: Semantic edge bundling with biclusters for sensemaking." IEEE transactions on visualization and computer graphics 22.1 (2016): 310-319.
Run the Demo
- Install node.js on your system.
- Clone this repository.
- Run
npm installin the repository root. - Run
npm startin the repository root.
As an alternative to the last step you can just open index.html, click the browse button, and select data.csv manually.
NOTE: Your browser must be ES2016 compatible.
Generate the Docs
npm run-script docsGenerated docs will be located in out/index.html.
Features
- Visualize custom CSV files with two or more columns.
- Entities have an indicator encoding their frequency in the data.
- Mouse-over an entity or bundle highlights adjacent edges.
- Bundle width encodes the size of the bundle, matching entity frequency indicators.
- Bundles have an indicator encoding the size of the source set.
- Entities and bundles can be selected.
- Entity and bundle colors encode the number of selected neighbors.
- Edge colors encode the average relevancy of their source and target.
- Entities can be sorted by frequency, label, or priority (bundle size).
- Modes for displaying edges only, bundles only, or a combination of both.
- Options for filtering bundles based on their size.
Interaction
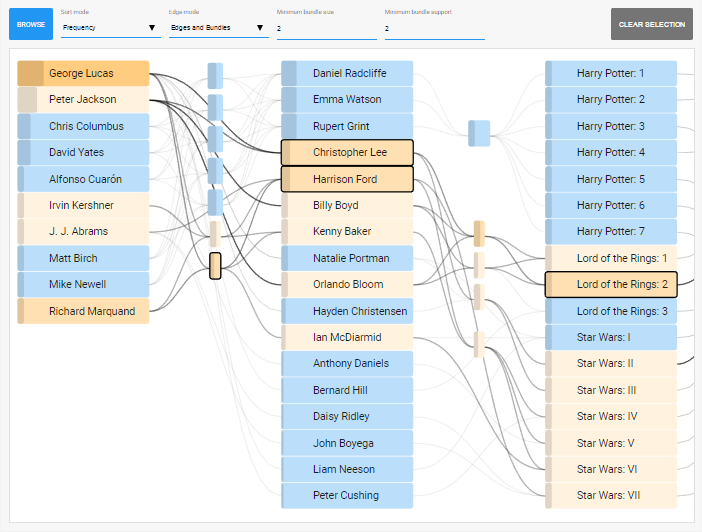
A default data-set is shown when the visualization is loaded. Using the browse button in the top-left corner a different CSV file can be selected for analysis. (Warning: large tables can crash the application.) To the right of the browse button are options for sorting the entities, showing or hiding bundles, and filtering bundles by their size and number of entities on either side of the bundle (a.k.a. bundle support). The Clear Selection button in the top right deselects all selected entities and bundles.
The data can be explored by clicking on entities and bundles, which highlights connected elements. A darker orange color indicates a strong relationship of an element with the current selection and provides a hint for further exploration.
Important files
index.htmlEntry point of the application. This file also defines the user-input widgets at the top of the application window.biset.cssStyles for the SVG part of the visualization.src/main.js Handles the user-input widgets at the top of the application window and the instantiation of theBisetobject.src/biset.jsDefines theBisetclass which renders the SVG part of the visualization and provides setters for the various parameters.src/bundle.jsDefines internal functions used for discovering bundles in the data.src/transform.jsDefines internal functions used for transforming the initial CSV data into a representation that can be rendered.src/data.csvInitial data-set that is shown when the application is loaded.