 |
ICSV - Image Color Similarity Visualization
Vienna Technical University - Course 'Visualization 2'. Author: Stefan Spelitz (0925601)
|
|
ICSV - Image Color Similarity Visualization
Vienna Technical University - Course 'Visualization 2'. Author: Stefan Spelitz (0925601)
|
A Metric for Distributions with Applications to Image Databases, Rubner et al., 1998
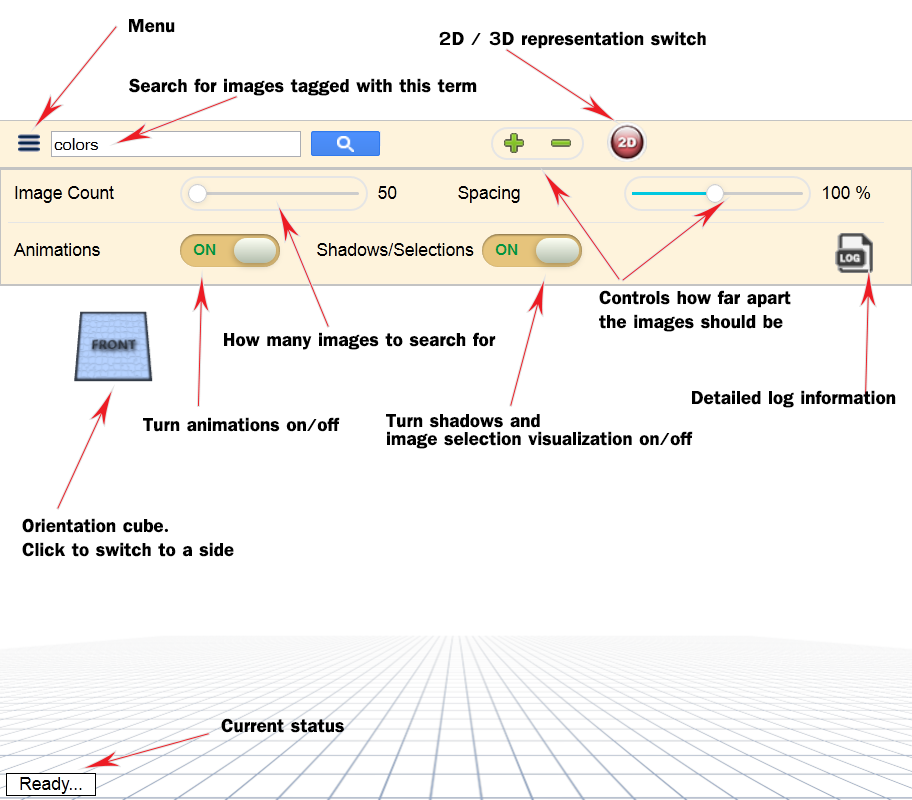
The rotation of the camera has 2 modes (in 3D representation):
Explanation: The first mode is enabled if the camera is far away from images. The second mode becomes automatically enabled as soon as one gets close to images. This is useful to rotate one's viewpoint around and look at images.
Rubner et al. describe in their paper a visualization method for presenting a large amount of images grouped by similarity. Similarity is given either by color similarity or by the texture of images.
In this project only similarity by color is considered. The goal is to arrange images in such a way that images with similar colors should be arranged close together while images with a different color appearance (e.g. an image of a sunrise and an image of the sea) should be far apart.
The original paper only considers arrangement in a 2D space. While this project also allows 2D visualization, it focuses on the possibility to arrange the images in a 3D Euclidean space.
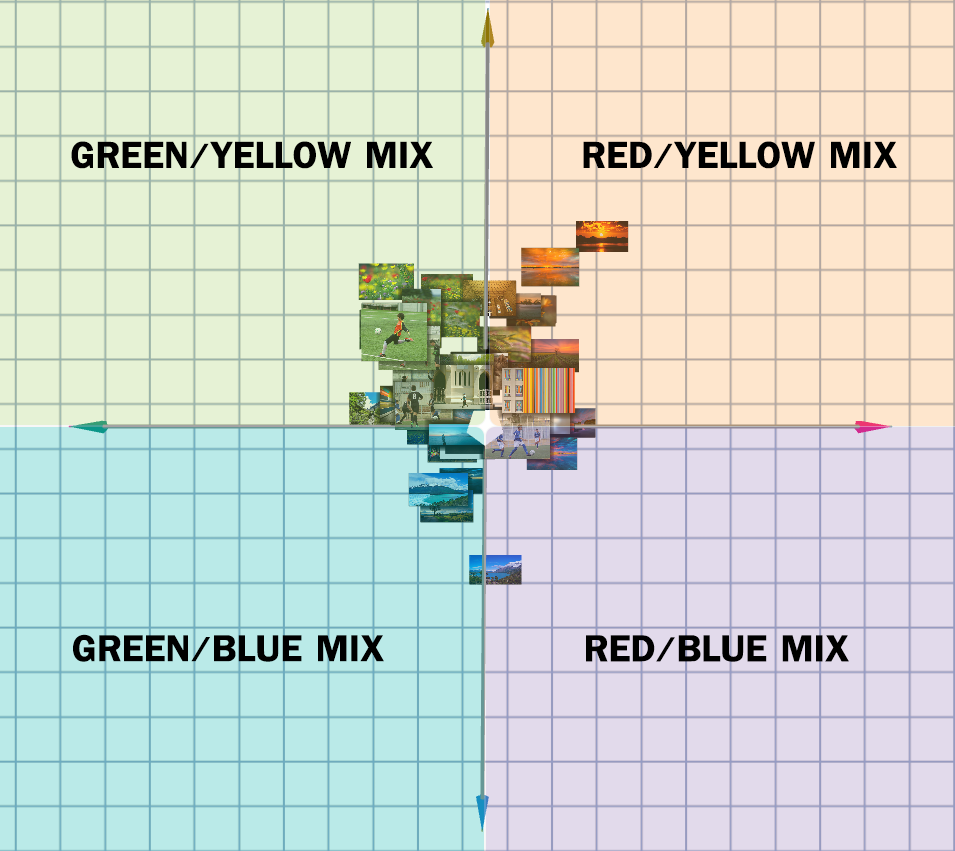
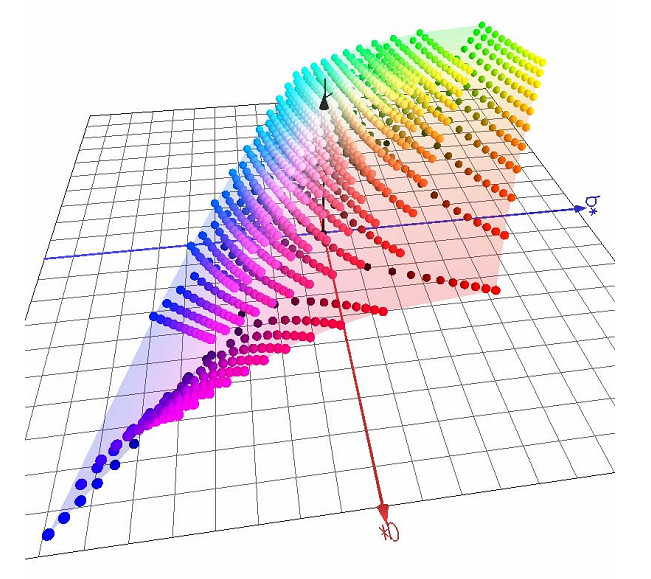
Images in a 3D space are arranged along three axes, according to the CIE Lab color space. These axes are:
Examples: An image containing mainly blue colors would be arranged on the negative side of the 'b' axis. An image containing both blue and red dominating colors would be located in between the axes 'a' and 'b' (i.e. in between the negative side of 'b' and the positive side of the 'a' axis). In the example below an image with both red and blue dominating colors would be located in the 'red/blue mix' area.
To arrange a given set of images according to their color similarities these steps are necessary:
The conversion to CIE Lab color space is necessary, because this color space is perceptually uniform. This means that colors which appear similar to the human perception have a lower distance than colors which appear different. Since we need a useful distance metric for color similarity the CIE Lab color space is more useful than the RGB color space.
Signatures can be seen as a general form of histograms, but with variable-sized bins (see original paper for details). Signatures are created by clustering the pixels of an image with a kd-tree. This is done in multiple stages:
This clustering is proposed by Rubner et al. in The Earth Mover's Distance as a Metric for Image Retrieval. Please note that the kd-tree clustering is not done with the median of a point set, but by splitting an interval into two equal sub-intervals.
The EMD is calculated by using an adaptation of the JFastEMD framework.
The MDS is approximated with an algorithm based on landmark points. See V. de Silva, J.B. Tenenbaum, Sparse multidimensional scaling using landmark points. A fast implementation is provided in the MDSJ library.
To calculate the axes (more precisely: calculating the position of the axes for the given image set) of the CIE Lab color space the following algorithm is proposed:
The MDS will then deliver a position for each point of the axes, but the axes will be arbitrary rotated and the resulting Euclidean space will be arbitrary scaled. Therefore as a final step to allow consistent presentation of the resulting space, the following will be done:
In addition the Gram-Schmidt algorithm could have been used to create an orthogonal coordinate system. This can be seen as future work.
The project consists of:
The server is responsible for loading images from Flickr and calculating the positions in a 2D/3D Euclidean space. This information can then be used by the client to visualize the images in WebGL in addition with the Three.js framework.
This architecture has the advantage to allow low-performance (mobile) clients to use the application without having to run the performance-consuming algorithms, such as MDS and the EMD.
 1.8.9.1
