1. Abgabe
Introduction
This software visualizes static 2D flow data provided by the user. It offers various methods to display the data, including color coding, arrow plots and a variety of streamlines. The resulting visualization is arranged in layers, one for each method, which are blended to produce the final image. All parameters can be edited interactively, and the user can save an image of the current view.
Download
The software is available here: Beispiel2.zip.
Installation
No installation is required. Simply extract the downloaded archive and run "Beispiel2/Beispiel2.exe".
Usage
First, open a data set you want to view. From the menu, select "Datei / Datensatz laden..." and open an appropriate file. You should then be able to see a visualization of the data in the main view to the right.
The parameters controlling the visualization process are located to the left, and grouped according to visualization methods. Each of the image layers can be activated separately.
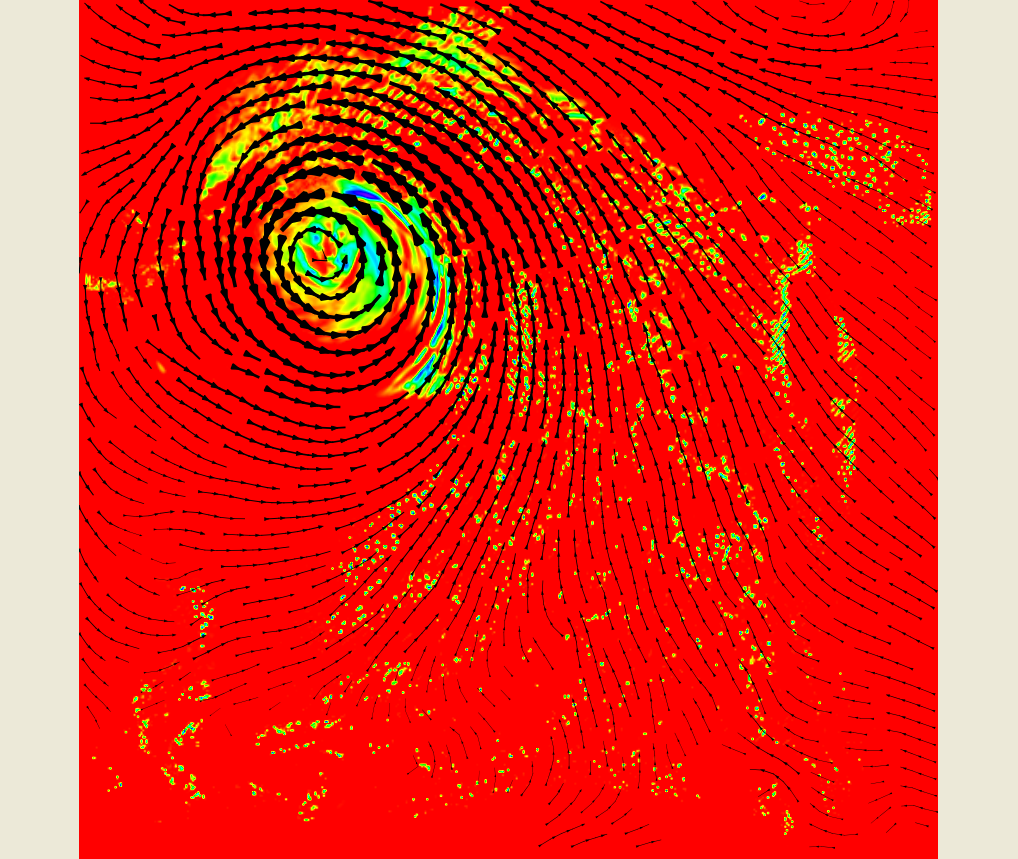
For color coding one can set the channel to display and select one of several color gradients. The current color gradient is displayed below.
The vector data displayed by arrow plots and streamlines can be selected in the "Vector Channel" group box. It allows to select X and Y channels of the vector data and shows the number of the channel which contains the vector length derived from the data.
Arrow plots are controlled by setting the grid size on which arrows are placed, and the maximum size of arrows relative to the grid size. Arrows are scaled so that their area is proportional to the normalized channel value.
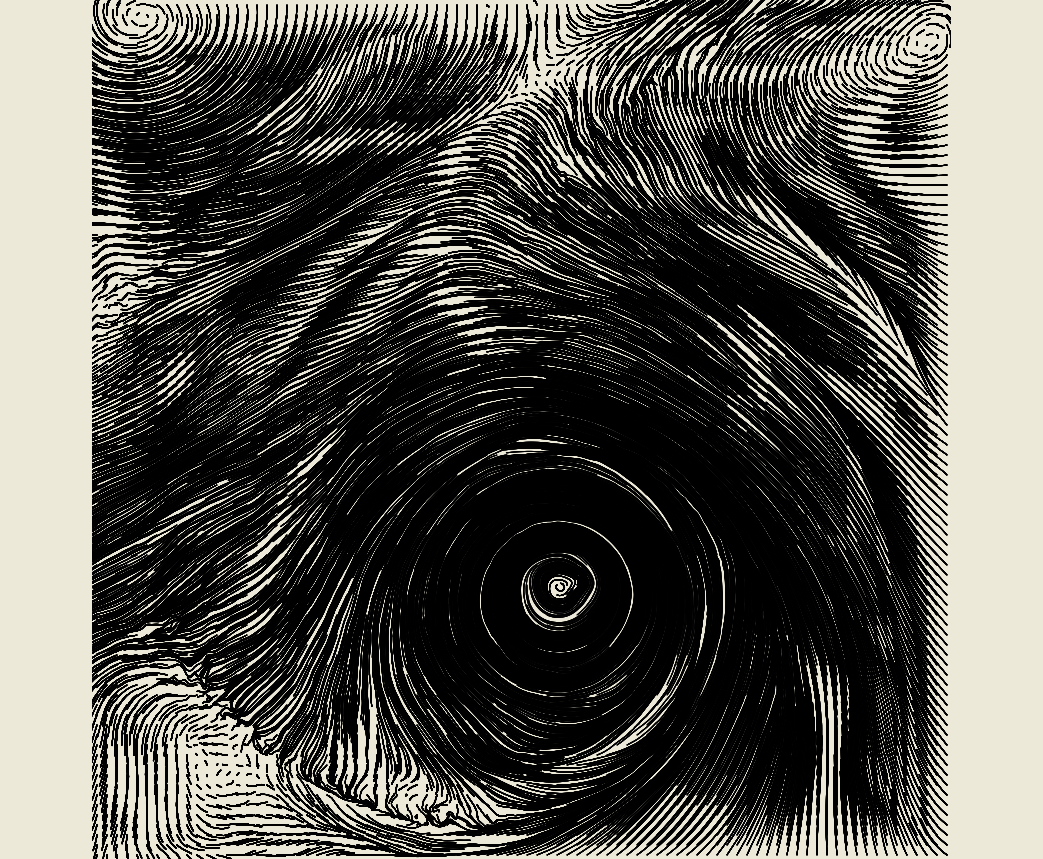
Streamlines have a multitude of options. Integration is done using Euler or Runge-Kutta methods, and the time step and maximum number of steps can be set. The spacing of streamlines can be regular, meaning streamlines will start at points on a regular grid, or evenly spaced.
Additionally streamlines can use tapering to visualize vector lengths and glyph mapping to place arrows on streamlines in an equidistant fashion.
Examples
Created by Simon Parzer and Stefan Fiedler.