User documentation
Basics
Before you can start working, you need to load a dataset. Go to File -> Open and select a file to open (it should conform to the the VisLU specification).
Transfer functions
The transfer function enables coloring of both slices and volumetric data. On the upper part of the transfer function widget, a histogram of intensities is shown. There, alpha values for each intensity can be set. To change the alpha function, left click to add a new control point, click and drag to move the control point, and right click to delete a control point.
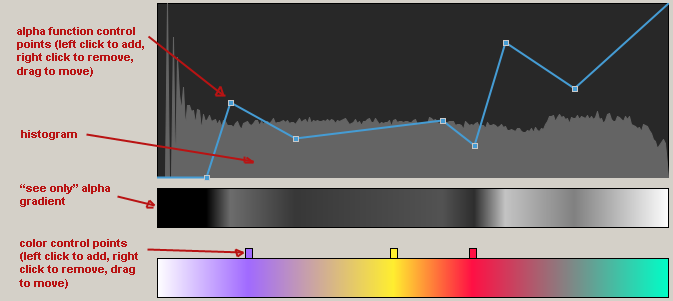
Under the histogram, an initially white stripe is present. Click on it to add new color control points. Click and drag to move those control points around, right click to delete those control points. Using the color control points, you can create gradients for various intensities.
The transfer function can be saved and loaded using the drop down menu on top (Transfer -> Load Transfer Function / Save Transfer Function).
Over the transfer function a combo box displaying all the possible transfer function one can choose is visible. You're allowed to change tre transfer function for any of the 3 background channels (see below) and for the arrows.
Background layer
Each dataset contains the vector data, out of which the dataset intensity at the given point can be deduced, and 2 additional channels (depends on the specific dataset). You can choose one of those three channels as the background for your visualisation, just go to the channels tab and choose the channel that you want as the source for your background image. The background channel cannot be disabled.
Arrows layer
Enable/disable arrows using the checkbox, set the amount of arrows using the slider (the actual number of arrows will always be odd).
Streamlines layer
Enable/disable streamlines using the checkbox, choose a method for generating the seedpoint using the Starting seeds combo box, set the number of seeds using the Number of seeds (X) and (Y) (for random starting points, just input 1 for one of them and the desired value for the other one), and check the bottom two combo boxes for euler/runge kutta streamlines. Also, for each of them, you can set the step size.
Glyphs layer
Go to the glyphs tab, enable/disable glyphs using the combobox. Set the size of the glyphs using the numerical input field.
Evenly spaced streamlines
In the ESS tab, options for the evenly spaced can be set. Separating distance, testing distance percentage (of separating distance), tapering (enable/disable, no parameter setting) and whether to use these algorithms at all are your choices.