|

|

|
|
Introduction
|
|
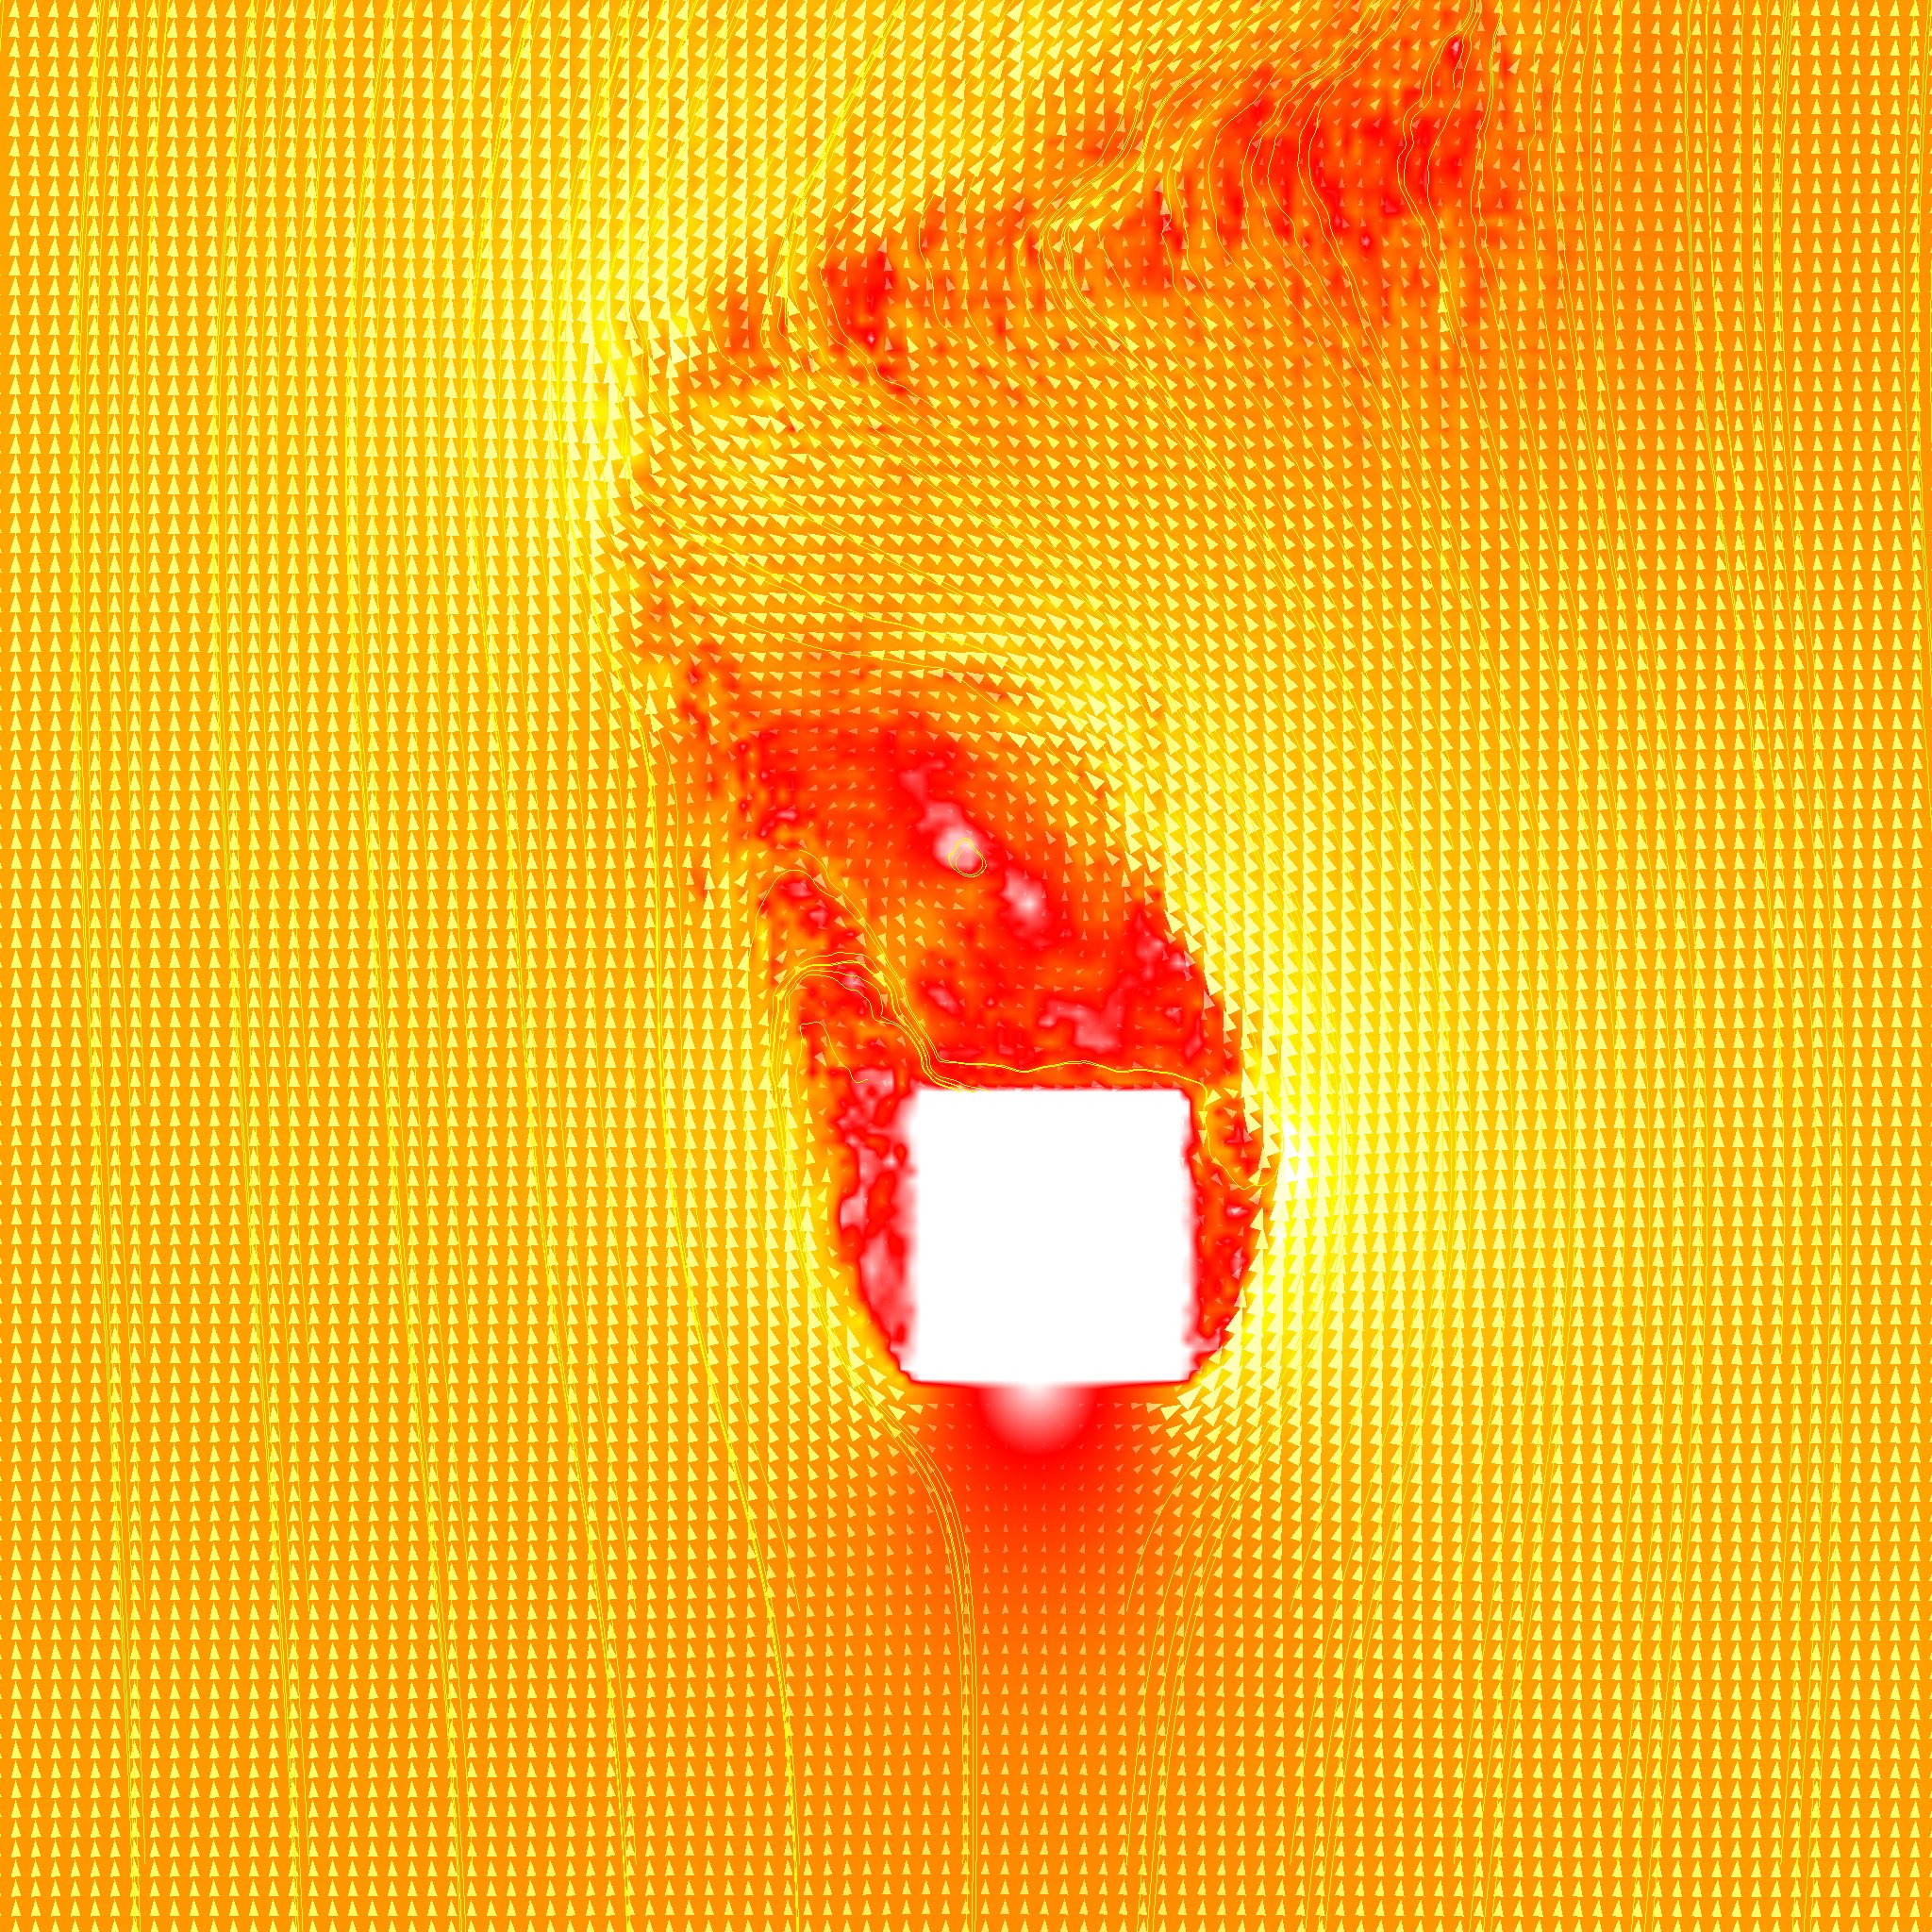
FlowVis is a tool to visualize 2D flow data. It uses techniques described in the paper Creating Evenly-Spaced
Streamlines of Arbitrary Density [1].
|
|
|
|
|
|
|
Graphical User Interface
|
|
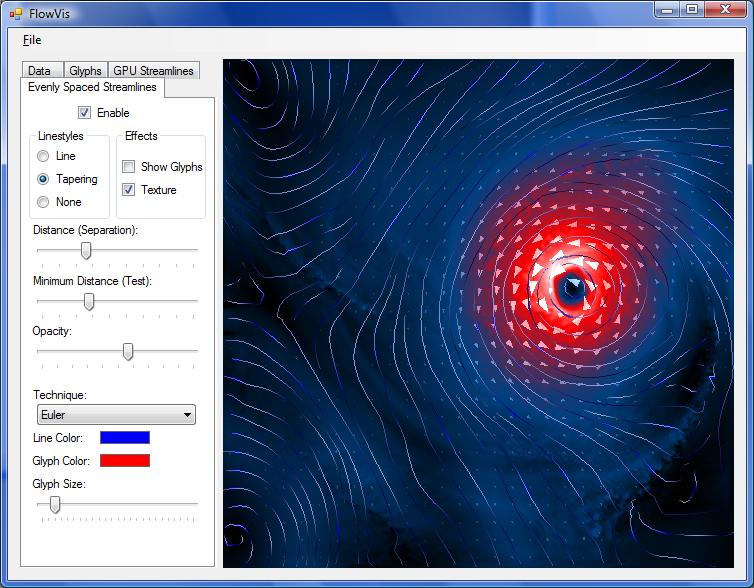
The main window is split up into two panels, the
view panel and the control panel
|
|
|
|
Main Menu
|
|
File
-
Open: Opens a flow dataset
-
Save Image: Saves an image
of the current view. Width and height of the image must be entered.
-
Exit: Closes the program.
|
|
|
Control Panel
|
|
The Control Panel provides following sub-panels:
- Data
- Glyphs
- GPU Streamline
- Evenly Spaced Streamlines
|
|
|
Sub Panel
|
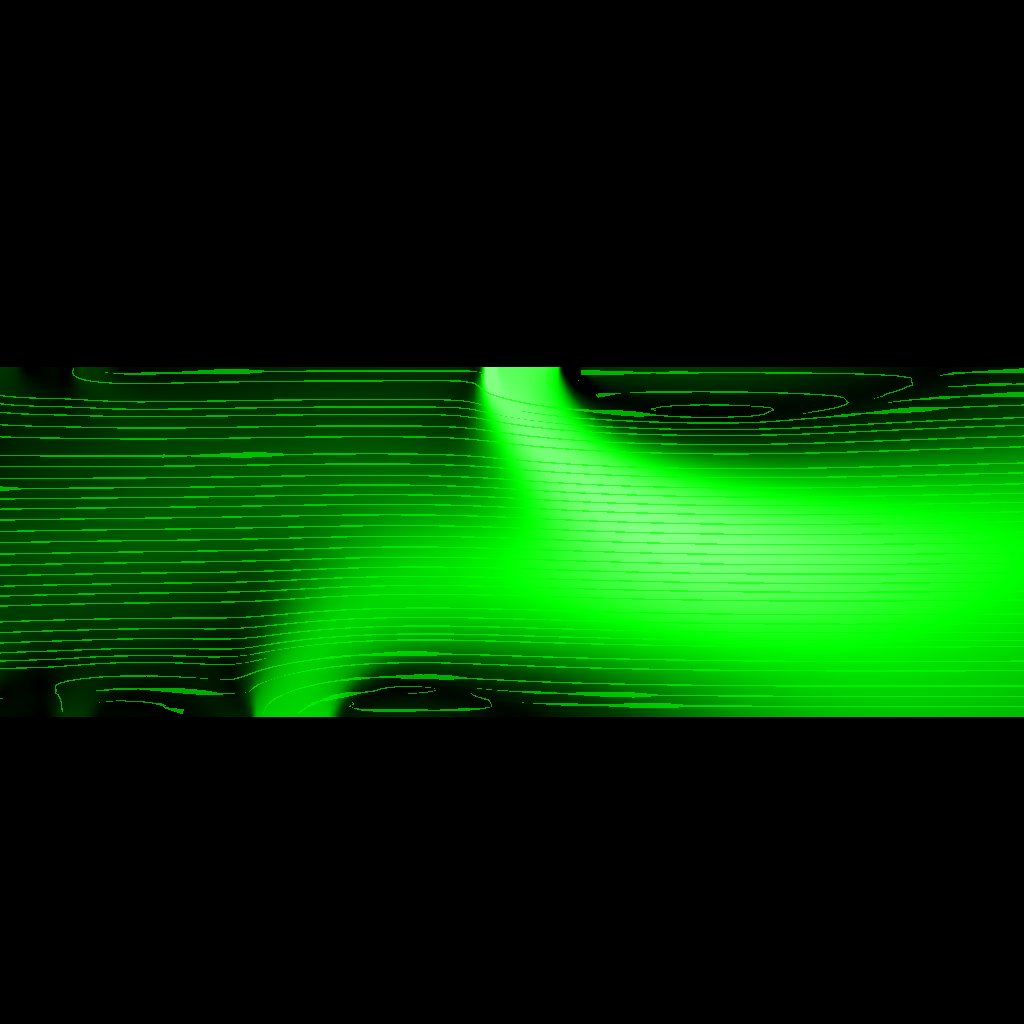
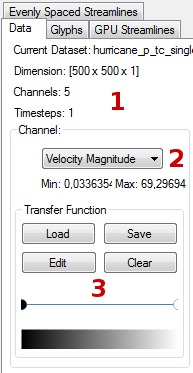
Data Panel
In the data panel the dataset information is displayed and channel +
transferfunctions can be selected.
- Dataset Information
- Select Data-Channel
- Load / Save / Edit transfer function for the
currently selected channel
Glyph
Panel
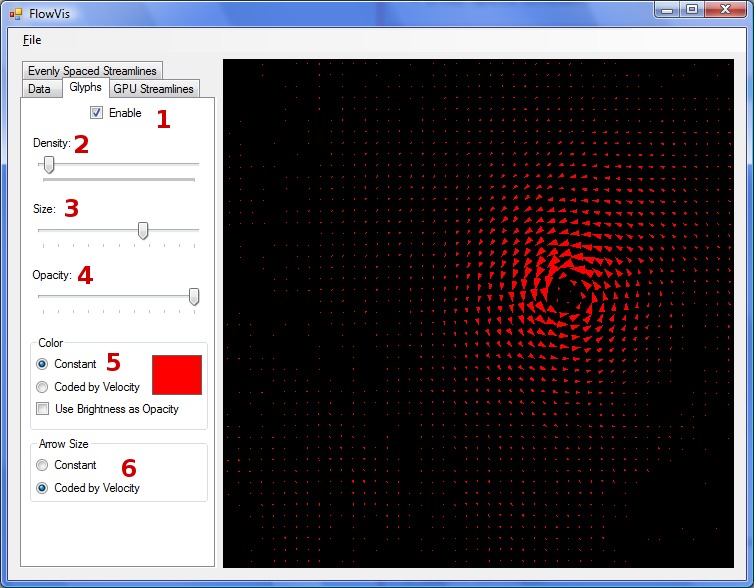
Shows glyphs on a regular grid
- Enable / Disable Glyphs
- Glyph Density
- Size of the Glyphs
- Opacity of the Glyphs
- Color Mode (Constant, brightness of Glyph codes
velocity, use brightness as as opacity value)
- Arrow size (Constant, Size codes velocity)
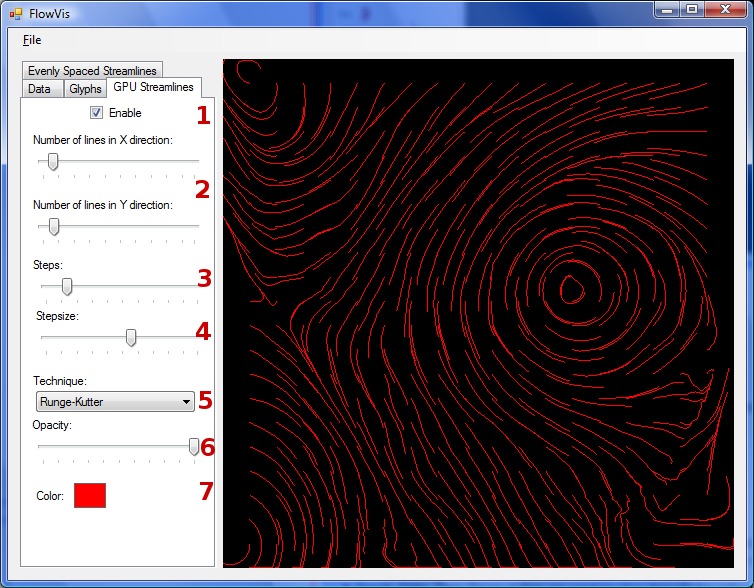
GPU
Streamlines Panel
Shows Streamlines calculated on the GPU with seed points on a regular
grid.
- Enable / Disable GPU Streamlines
- Number of seed points in X and Y direction
- Number of integration steps
- Stepsize of one integration step
- Integration technique (Euler or Rungge/Kutter)
- Opacity
- Color
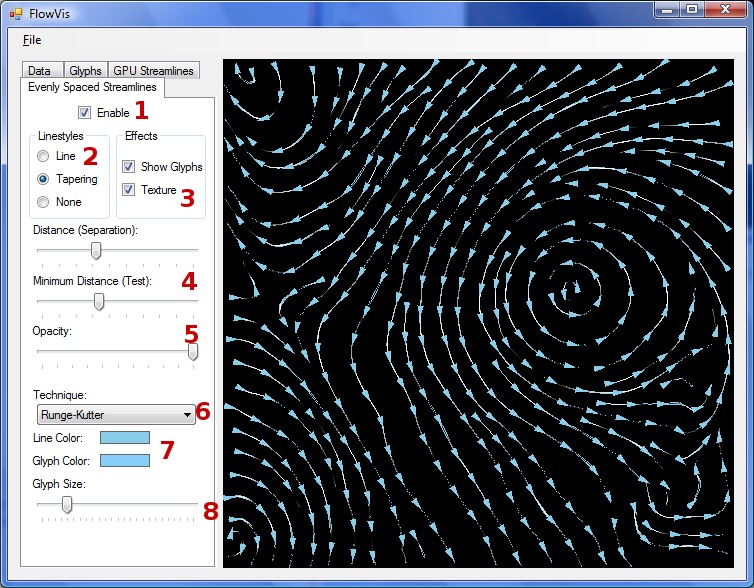
Evenly Spaced Streamlines
Shows evenly-spaced streamlines [1].
- Enable / Disable GPU Streamlines
- Linestyle (Line, Handdrawn style (Tappering),
None)
- Line Effects (Glyphs, Texture)
- Density (Seperation and Testing distance)
- Opacity
- Integration technique (Euler or Rungge/Kutter
- Line and Glyph color
- Glyph size
|
|
|
|
Transfer Function Editor
|
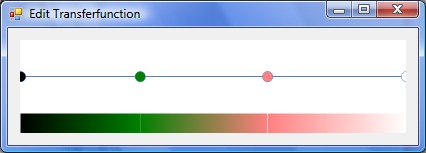
Using the Editor
Double
Clicking with the left mouse button adds a new color point.
Use drag & drop with the left mouse button on a point to move
it around. Clicking on a point with the right mouse button deletes it.
Double-Click on a color point opens the color dialog and a new color
can be selected for that point. The first and the last point are fixed
and cannot be moved or deleted, except the color value for the first
and last point can be set.
|
|
|
References
|
|
[1] Jobard, B. and Lefer, W., "Creating
evenly-spaced streamlines of arbitrary density", Visualization in
Scientific Computing, Vol 97, pp. 43-56, 1997
|
|
|
|