|
|
|
|
|
|
Introduction
|
|
Author: Thomas Pönitz (0425863)
This application has been developed in the course of the Visualisierung LU during winter term 2008/2009.
It enables you to visualize flow data and is based on [1] Creating evenly-spaced streamlines of arbitrary density (1997) from Bruno Jobard and Wilfird Lefer.
|
|
|
|
|
Graphical User Interface (Overview)
|
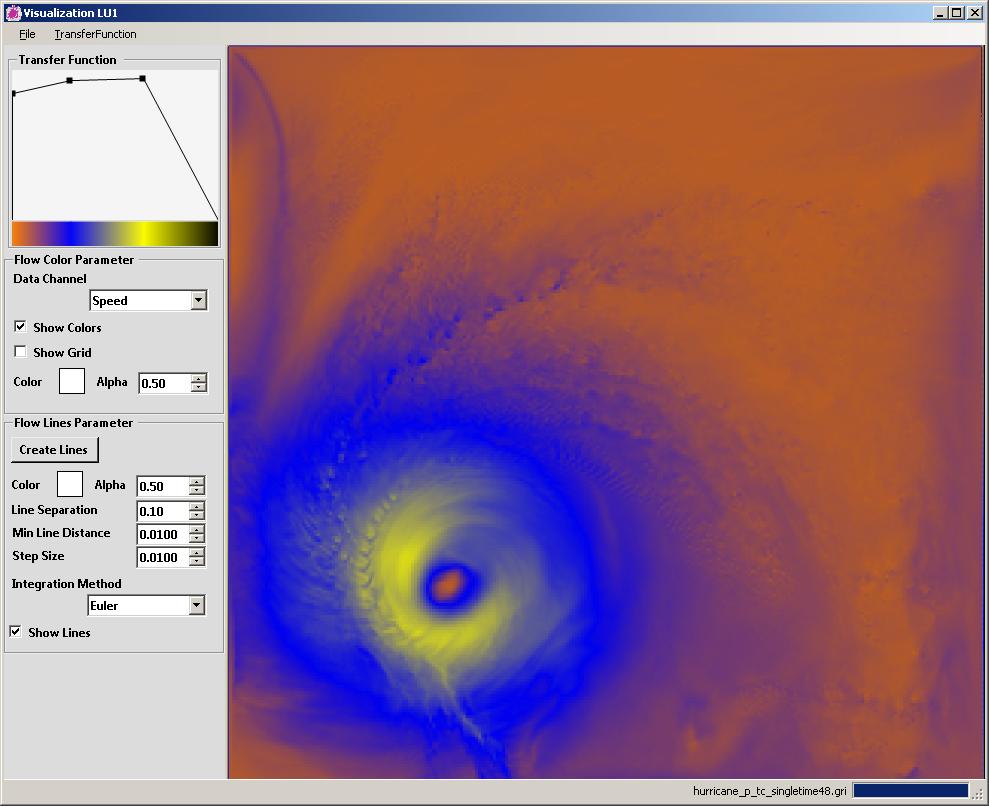
The window consists of 4 panels:
- Viewport panel: The rendering viewport
- Line Control panel: Controls the flow lines (step size, line distance, integration method, ...)
- Color Control panel: Lets you select the data channel, grid drawing
- Transfer function panel: Gives you control over the visualization of the selected data channel
There are additional controls in the window menu:
- File: load data files
- Transferfunction: load/save the transferfunction
|
|
|
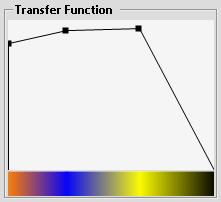
Transfer Function
|
|
Defines a transfer function which mapps a data value to a color and opacity value.
- A left double click inserts a point
- With a right click you can choose a color for a point
- Dragging with the left mouse button moves the point
|
|
|
References
|
|
[1] Bruno Jobard and Wilfird Lefer, "Creating Evenly Spaced Streamlines of Arbitrary Density", Visualization in Scientific Computing '97, Springer Vienna, 1997, pp. 43 - 54.
|
|