|
|
|
|
|
|
Introduction
|
|
This application has been developed in the course of the Visualisierung LU during winter term 2007/2008.
It enables you to visualize 2D flow data
|
|
|
|
|
Graphical User Interface (Overview)
|
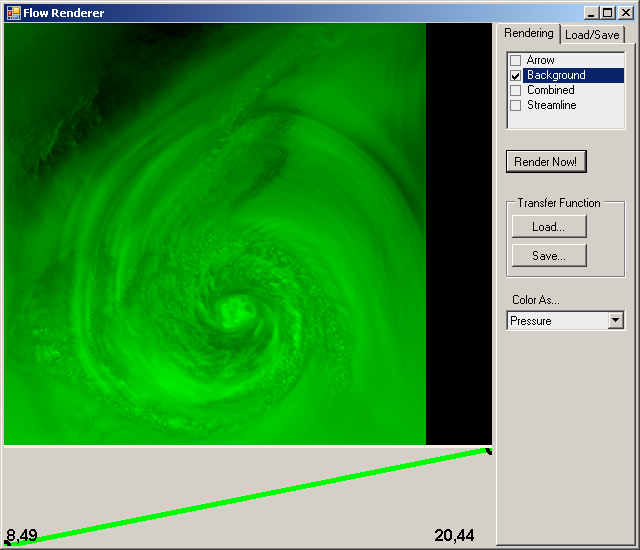
The main window basically consists of up to 3 panels:
- rendering panel: here you can see the result of the visualisation
- control panel: allows you to load datasets, define the type of rendering, etc.
- transfer function panel: used for creating a transfer function
|
|
|
Load/Save
|
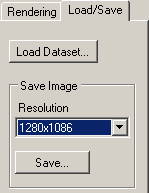
- Load Dataset: allows you to load a datasets of type DAT
-
Save Image: save an image to a file (JPEG)
- Resolution: 320 up to 2048 pixel (horizontal)
|
|
|
Rendering (Arrow)
|
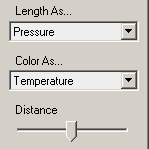
- Length As...: the length of the arrows should be represented by the select property
- Color As...: the color of the arrows should be represented by the select property
- Distance: distance between the arrows
|
|
|
Rendering (Background)
|
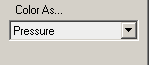
- Color As...: the color of the skalar values (pixels) should be represented by the select property
|
|
|
Rendering (Combined)
|
- a combination of the activated rendering modes
|
|
|
Transfer Function
|
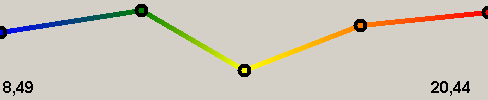
In rendering modes Arrow, Background and Streamline you have the possibility to define a transfer function wich is used for mapping the data value to color and associated opacity values.
It is also possible to load or save a transfer function in these modes by using the buttons Load... and Save...
Additionally the minimum and maximum values of the selected property are displayed.
- By clicking with the left mouse button into the area of the transfer function you create a point at this position
- By using the "drag & drop" method you can change the position of the the point. Simply click on a point, hold the mouse button pressed and then move the mouse. When you release the button again the point is set at the new location.
- Double clicking onto a point opens a window where you can define its color.
- Clicking with the right mouse button onto a point removes it from the transfer function and its neighbour points are connected with each other.
|
|


