


Next: Discussion
Up: Visualization of critical points
Previous: SPHERETUFTS - using many
Combining CHARDIRS and SPHERETUFTS
If both methods presented in the previous two sections are
combined, the following advantages are achieved: first, a
complete description of the flow topology is given through the
CHARDIRS visualization. Additionally direct visualization cues are
used to intuitively describe the local flow dynamics.
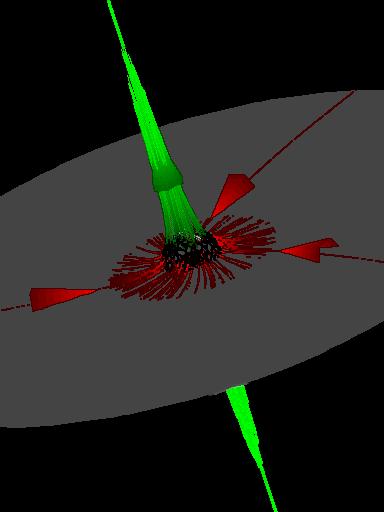
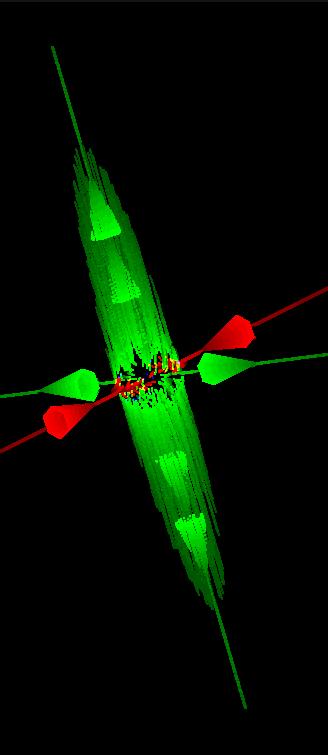
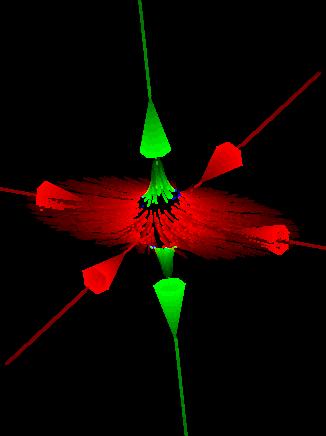
Fig. 6.5 demonstrates this combination of
advantages in three different linear cases. A saddle focus
(Fig. 6.5(a)) and
two saddle nodes (Fig. 6.5(b,c)) are shown.
Topology, geometry, and flow details
are integrated within one pictorial representation.
The figure on page ![[*]](cross_ref_motif.gif) shows the Lorenz
attractor visualized
with this combined technique. The strong differences concerning
velocity (about three orders of magnitude) become visible through
direct visualization, while still topological information is
provided.
shows the Lorenz
attractor visualized
with this combined technique. The strong differences concerning
velocity (about three orders of magnitude) become visible through
direct visualization, while still topological information is
provided.
Figure 6.5:
Three different saddle configurations visualized using
both the eigen-manifold visualization and bunches of
streamlets. [left image] [center image] [right image]
![\framebox[\textwidth]{
\begin{tabular*}{.93\linewidth}{@{}@{\extracolsep{\fill}...
...uler.3.ps}
\\ {\small{}(a)}
& {\small{}(b)}
& {\small{}(c)}
\end{tabular*} }](img250.gif) |
Helwig Löffelmann, November 1998, mailto:helwig@cg.tuwien.ac.at.