Java Exploration Tool for Dynamical Systems
by R. Wegenkittl and E. Gröller.
Project Duration: 1997
A detailed description is given in the paper
Fast Oriented Line Integral Convolution for
Vector Field Visualization via the Internet
(IEEE Visualization '97 Proceedings)
(Applet Version 1.0)
1) General Features
This Java Applet can be used for the exploration on two-dimensional analytical defined dynamical systems. The system is defined by a set of two differential equations, which will be evaluated within adjustable regions forming a two-dimensional vector field. Basic visualization methods as well as advanced methods can now be applied to the vector field. Each resulting visualization is displayed in an own window allowing easy comparison of different results. Some of the methods also can be animated to give a deeper insight to the systems dynamic. In the following a short description of the tool is given:
2) How to enter a dynamical system
The first two lines of the applet are used for entering the dynamical system (see Fig.1). The state variables are called x and y and only state variables (and no derivatives) can be used on the right hand side of the equations. For each variable a region can be specified, for which the vector field will be calculated. In the Parameter section nine parameter can be entered. This is useful for cleaning up the display of long formulas. Parameters can not only be defined by constants, but can also be made up by difficult calculations, state variables and other parameter (Attention: avoid recursive definition like "a = b" and "b=a" for they will result in a system crash).
Figure 1) The Applet with a dynamical system ready to start the exploration
2.1 Mathematical functions
The formulas for the state variables and for the parameter can consist of the variables x, y and all defined parameter as well as the constants PI and E. Mathematical functions taht are recognized are +, -, *, /, ^, sin(), cos(), tan(), sqrt(), exp(), exp10(), ln(), log(), abs(), ceil(), floor(), round(), asin(), acos(), atan() and actan(). All function have to be followed by parentheses.
2.2 Vector field conversion
The equations are evaluated automatically when a visualization method is applied. A blue progress bar indicates the advance of the conversion progress. The time used for conversion depends on the complexity of the formulas and on the resolution of the vector field (which is equal to the resolution of the visualization windows). The vector field resolution can be specified by the user by changing the values of the "Width" and "Height" fields (Attention: If a visualization window is already open, changing these values and displaying another visualization confuses the original window).
2.3 Input / output of systems
The applet provides a "Load System" and a "Save System" button. Unfortunately Java does not support local file access within a network. So these buttons show no effect except when the applet is viewed local within an applet viewer (and setting correct security options).
3 Visulization
3.1 General features
A visualization method is invoked by pressing the according button. If the vector field has not been evaluated yet (or has been changed) the equations are processed automatically, then the visualization window is displayed. Some techniques show a dialog box to allow changes of some parameter of the visualization technique. Then the visualization is calculated (which is again indicated by the progress bar) and shown in the window. When the user clicks with the mouse at a point within the visualization window according values (position, derivatives, vector length) are displayed in the bottom line of the applet. Each window can be closed separately by using the system menu or hotkey provided by your operating system.
3.2 Available visualization methods

The "Speed" button gives an overview of the magnitude of the vector field at each point. The magnitude of each vector is mapped to a gray scale value, where the color white indicates high velocity, whereas low velocities are mapped to black. A linear mapping is used, thus statistical outliers can produce low significant images. The mapping uses the minimum and maximum speed occurring in the vector field.
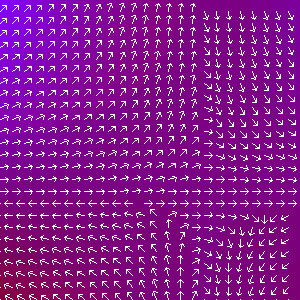
The "Direction" button evaluates the direction of the vector field and represents it as arrows and color coded. Some parameters can be adjusted within a dialog box (see Fig. 2). The arrows are placed on a regular grid with adjustable spacing in x and y direction. The length of the arrows is always constant and does not represent a magnitude of the underlying vector field. Additionally the directional information can be mapped on color, where the x component is mapped to blue and the y component to red. The color mappings can be made with offset, so that a x component of zero is mapped to 0.5, or without offset, which leads to discontinuities when a directional component changes its sign.
Fig. 2) Dialog box for direction visualization
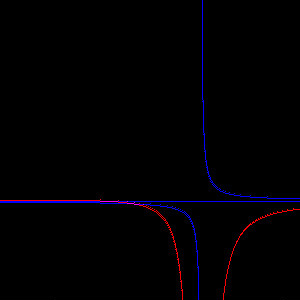
"Isoclines" shows curves within the vector field, where either the x or the y derivative is zero. Again color coding is used to distinct between curves that indicate x'=0 (red lines) and y'=0 (blue lines). Magenta lines indicate that both, the x derivative as well as the y derivative are zero.
3.2.4 Line Integral Convolution (LIC)
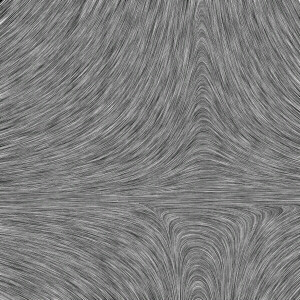
Line Integral Convolution ("LIC") is a standard visualization technique, where a noise texture is "smeared" along the vector field. This is done by filtering a white noise input texture along streamline segments. LIC uses one-dimensional filter kernels which are determined by integrating the underlying vector field. The length of the filter kernel can be specified by the user within a dialog box (see Fig. 3). Line integral convolution is a very time consumpting task. The calculation time depends on the size of the vector field and on the integration length.
Fig. 3) Dialog box for Line Intgral Convolution
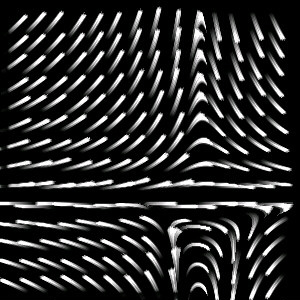
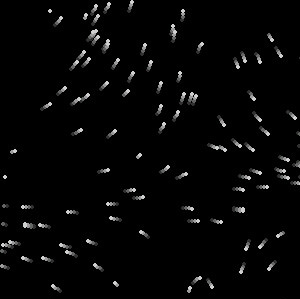
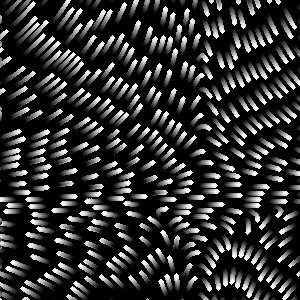
Oriented Line Integral Convolution ("OLIC") overcomes the disadvantage of LIC, which can not decode the orientation of a vector field. OLIC uses a sparse input texture and an anisotropic filter kernel. Various parameter can be specified by the user in a dialog box (see figure 4). As for LIC an integration length can be specified. This value is only valid if no speed encoding is used. When the field "Speed Encoding" is checked, the integration length depends on the magnitude of each vector in the vector field. The minimum vector length is integrated with "Min Speed Len" length, whereas the maximum vector length is integrated with "Max Speed Len" length. The sparse input texture is generated by distributing circular droplets with radius "Radius" on a regular jittered grid. The grid spacing in x and y direction can be specified separately as well as the amount of the jitter in x and y direction. An alternative method for generating the sparse input texture is by placing a number "Droplets" of droplets at random positions.
Fig. 4) Dialog box for Oriented Line Integral Convolution
"Particle" provides an animated particle system within the vector field. The number of particles can be specified within a dialog box as shown in Fig. 5. Due to the underlying dynamics of the vector field, parts of the window can be overcrowded with particles after a few time steps, whereas other regions are visited only by few particles. This disadvantage can be avoided by using the FROLIC visualization method.
Fig. 5) Dialog box for particle system
3.2.6 Fast rendering of oriented line integral convolution
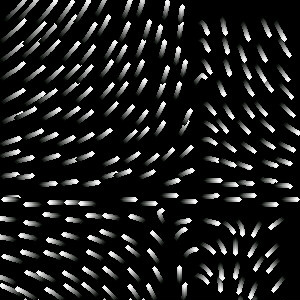
"FROLIC" is a fast approximation of an OLIC image. The approximation can be done so fast, that even animation of FROLIC is possible. The dialog box (see Fig. 6) resembles the one of OLIC, but it is extended by the animation possibilities. Another difference between FROLIC and OLIC is, that the "Colors" field corresponds with the "Integration Length" field of OLIC, but this field is important for speed encoded images too. This field indicates the number of circles that are used for the approximation of the OLIC image. So lower values fasten the calculation process (for animation), whereas higher values give a better approximation of the OLIC visualization. The "Random Offset" button can be used to avoid artefacts in animations. The offset moves the kernel for each streamlet by a random value. The "Ramp" value is used to dampen the kernel at the beginning and at the end. This again can be used to avoid artefacts within animations. The value is given in percent of the total kernel length.
Fig. 6) Dialog box for Fast Oriented Line Integral Convolution
3.2.7 Optimized placement for fast rendering of oriented line integral convolution
"Opimized FROLIC" resembles FROLIC, but tries to achieve a better streamlet distribution to avoid overlapping streamlets. Again the method can be animated. The dialog box resembles the one of FROLIC (see Fig. 7), but every streamlet that is placed within the image has a region of "Saftey Region" pixels around it, where no other streamlet can be placed. The placement is done in a cyclic order beginning in the middle of the window. The safety Region can be jittered by "Jitter (Saftey Reg.)" pixels. The streamlets can be moved by "Random Move" forward or backward (along the streamline). The length is measured in percent of the stream length. This option can be used to break occurring alignments. The distribution of the streamlets can be done with several passes, where for each pass the jittering of the grid, the jittering of the safety region and the random movement can be decreased by user specified values (in percent). Additionally a safe FROLIC pre pass and a post pass, where streamlets are distributed randomly to fill wholes in the image.
Fig. 7) Dialog box for Optimized Fast Oriented Line Integral Convolution
Institute of Computer Graphics - Visualization
and Animation Group - Research

This
page is maintained by RainerWegenkittl. It was last updated on April
22, 1997.
If you have any comments, please send a message to wegenkittl@cg.tuwien.ac.at.