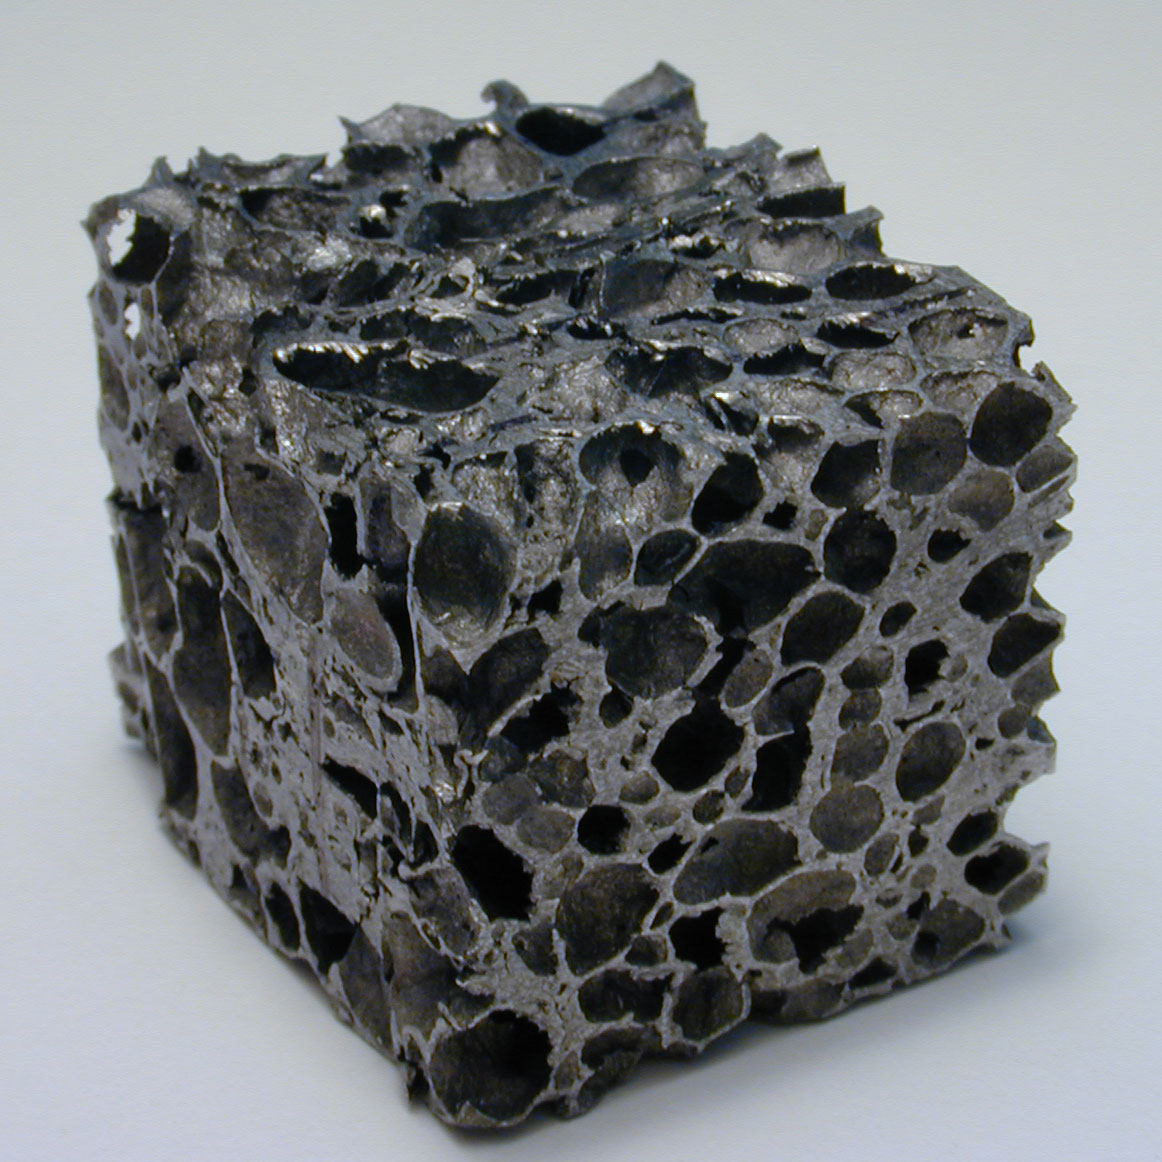
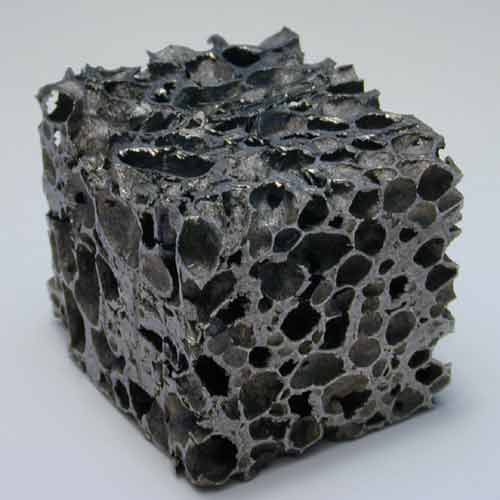
Picture of aluminium foam sample
Taken with Nikon Coolpix digital camera. Size of sample is 22.3 x 22.0 x 30.0 mm.
1162x1162 pixel
229KB
500x500 pixel
19KB
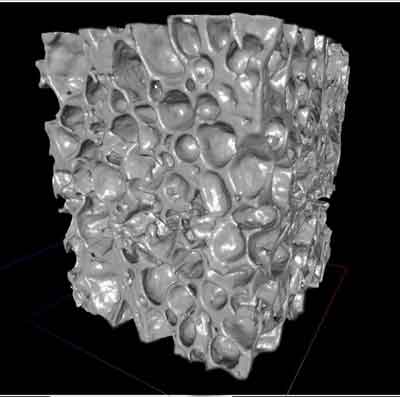
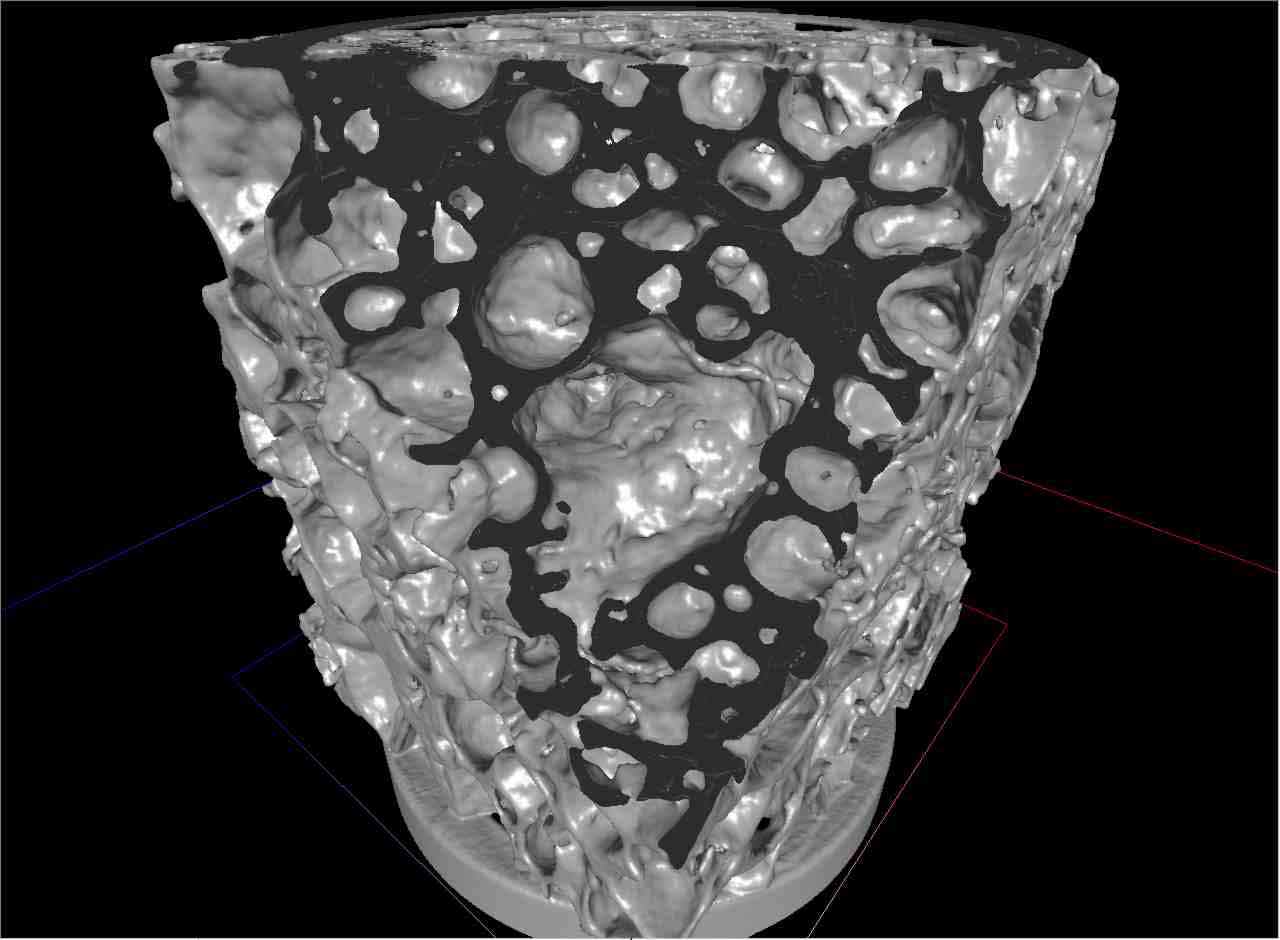
Generated visualization
OpenGl rendering, size of data set: 298MByte, 9112628 triangles rendered
709x703 pixel
29KB
400x397 pixel
12KB
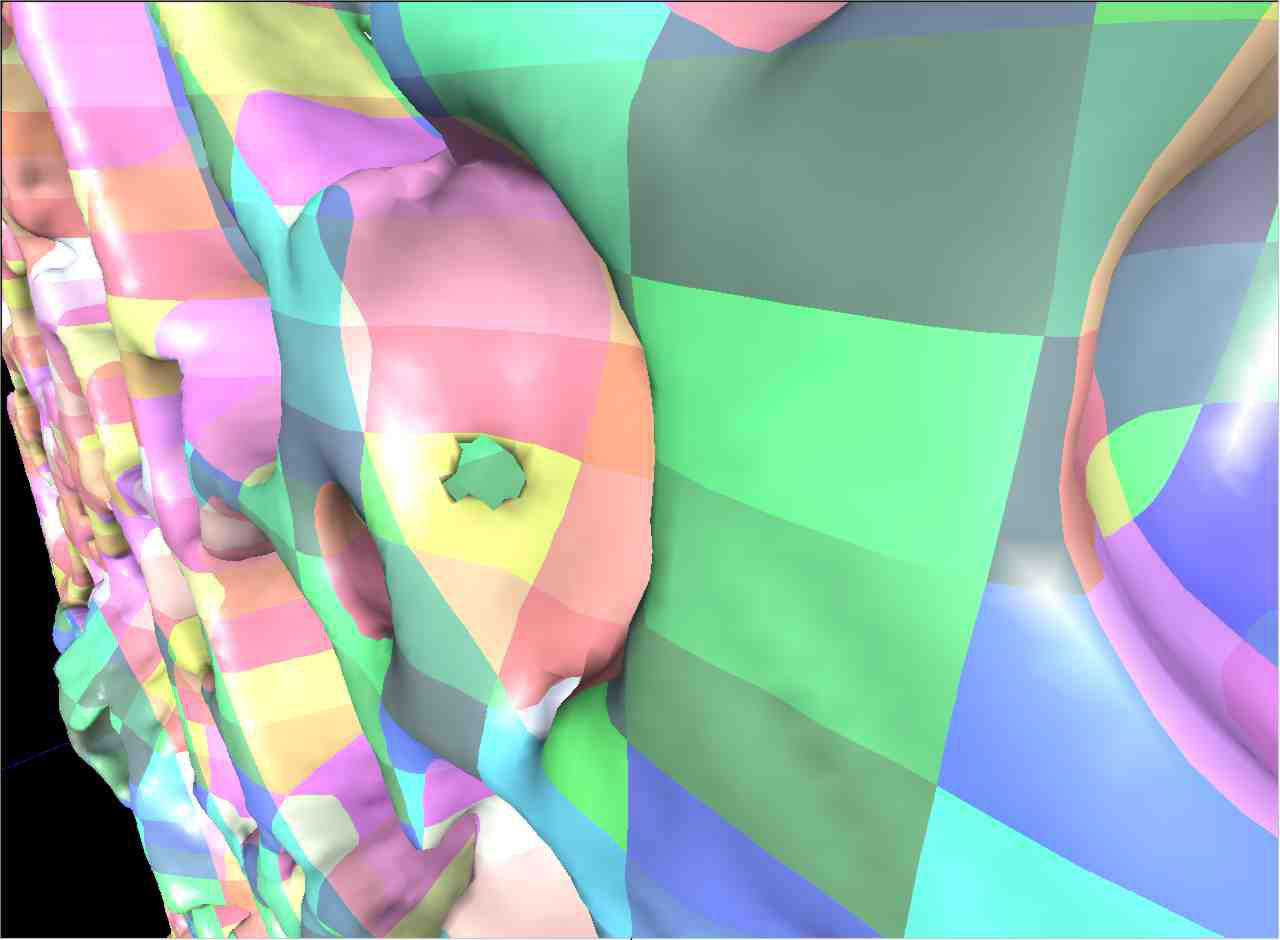
Colored macrocubes
Individually colored macrocubes allow a quick perception of feature size and depth information. The size of one macrocube in this image is 0.32 x 0.32 x 0.32mm.
1280x940 pixel
93KB
600x441 pixel
52KB
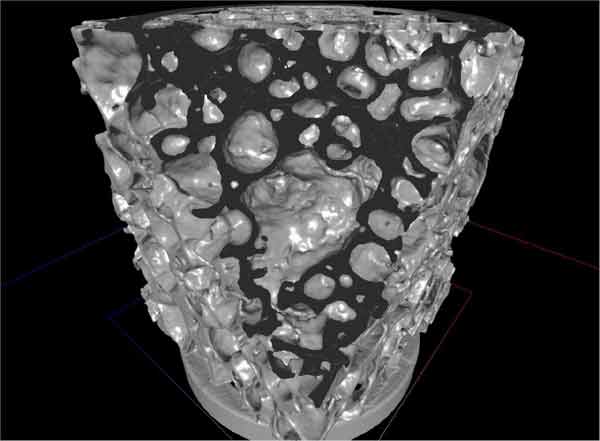
Cutting plane
Sample with cut-away part.
1280x940 pixel
54KB
600x441 pixel
19KB
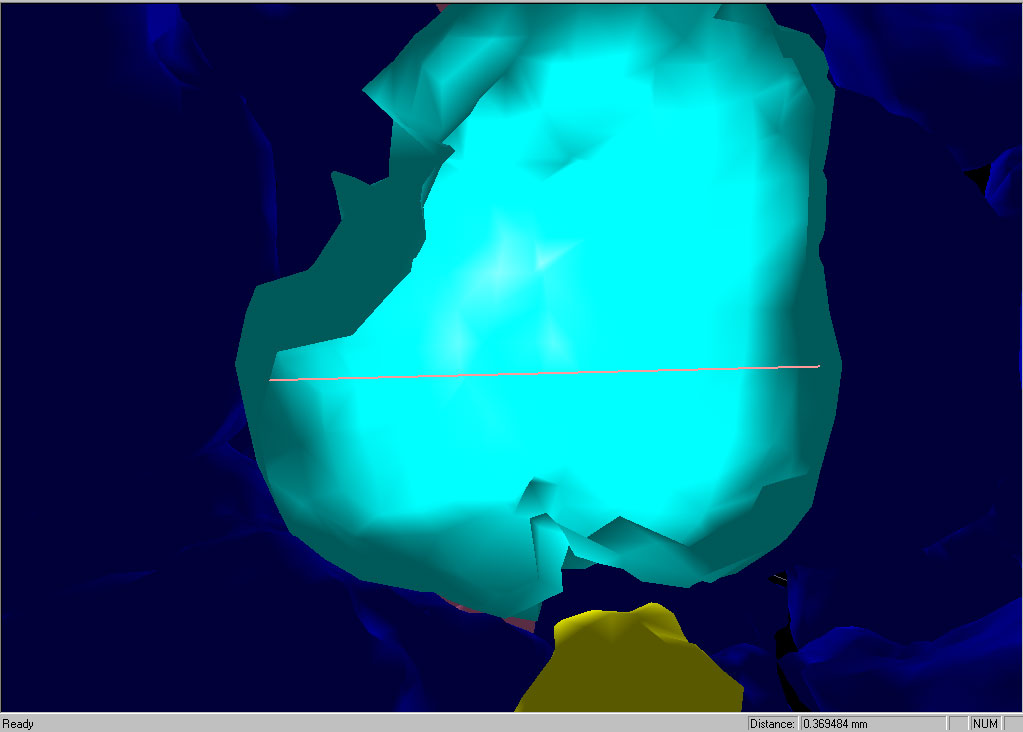
Distance measuring metaphor
The current length of the rubber band is 0.37mm.
1023x732 pixel
56KB
600x429 pixel
27KB
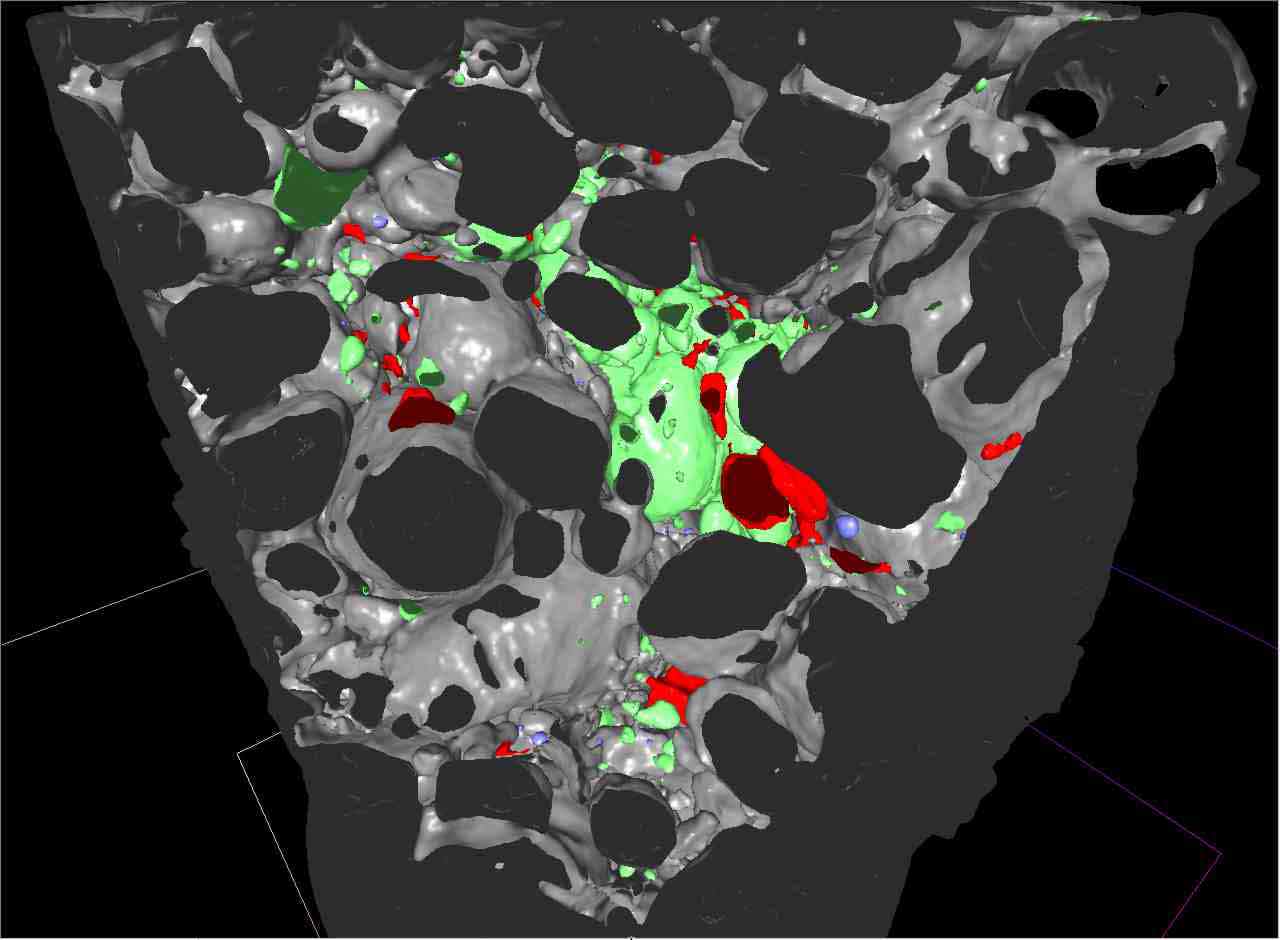
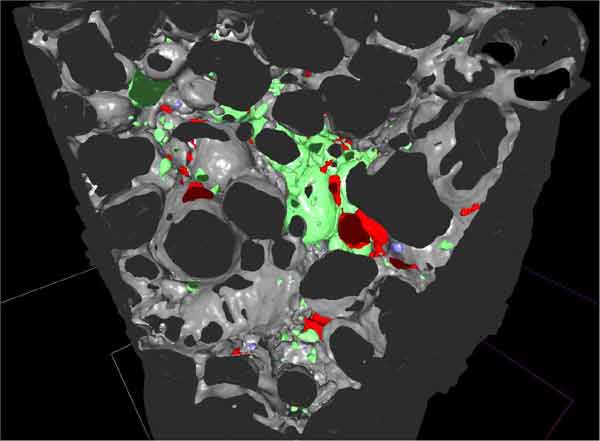
Focusing
Although the application of a cutting plane allows the localization of interesting features (upper image), it does not help to gain an overall impression of foam cell size and distribution. Focusing improves the situation (lower image). Only cells, which are not cut open by the faces of the sample are rendered. Colors indicate the shape factor of cells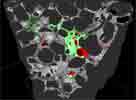
1280x940 pixel
53KB
600x441 pixel
19KB
1280x940 pixel
133KB
600x441 pixel
32KB
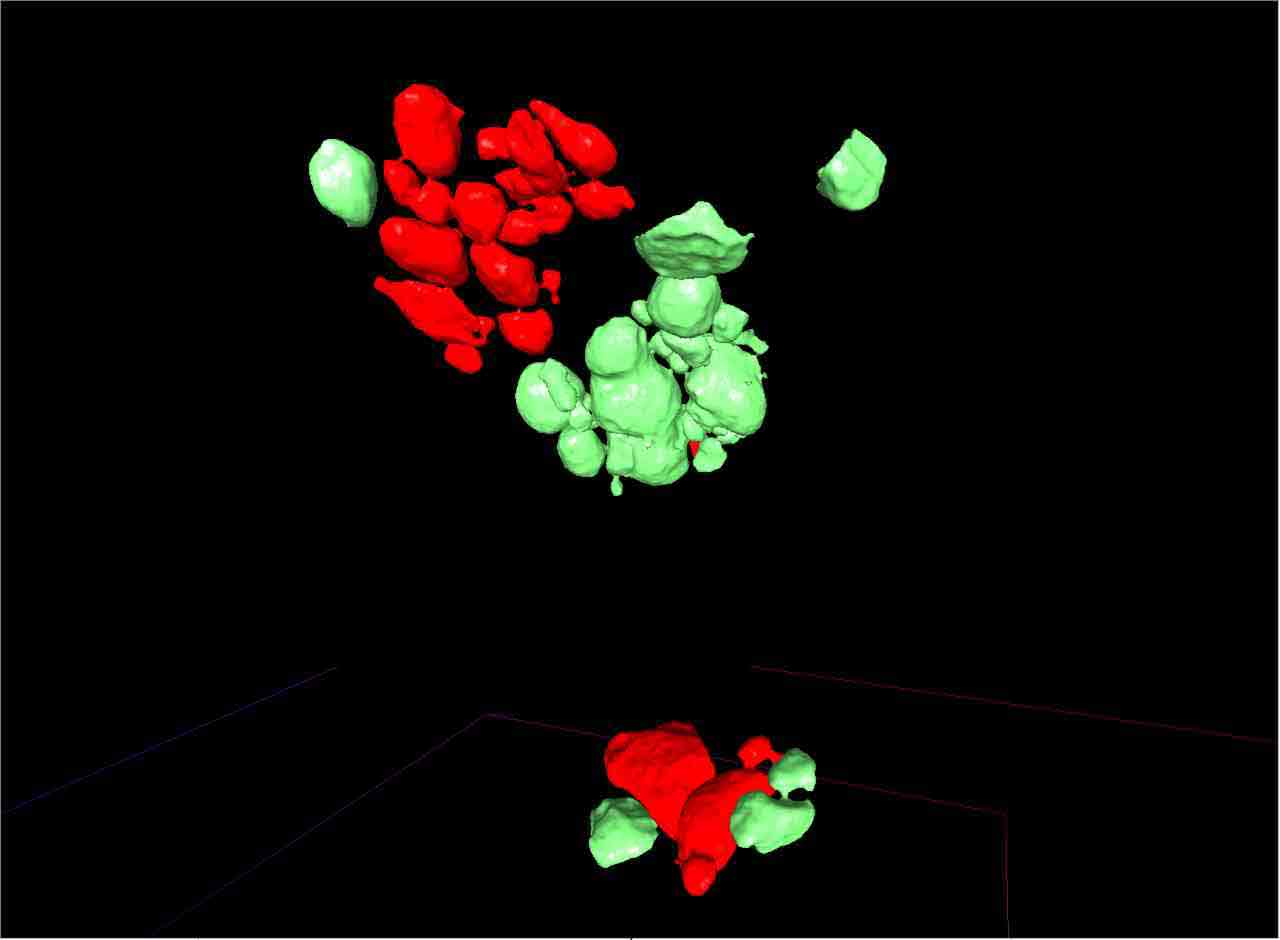
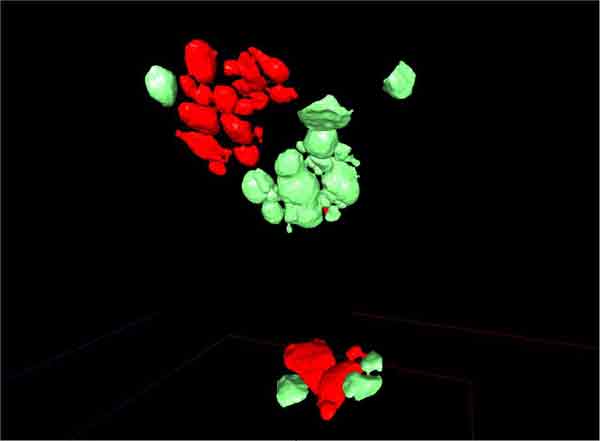
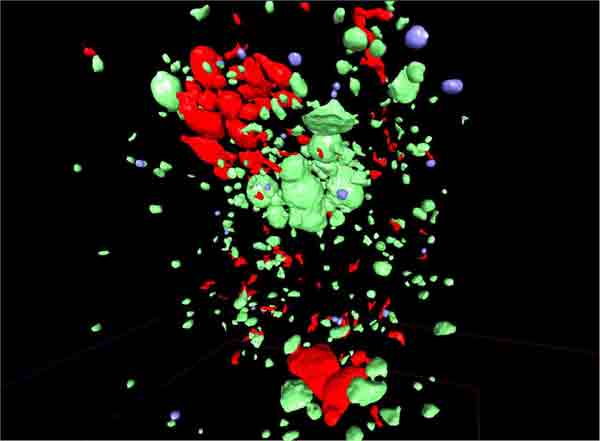
Focused View based on cell size
upper image: largest 10% of all foam cells, lower image: smallest 20%, middle image: both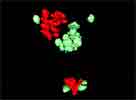
1280x940 pixel
22KB
600x441 pixel
8KB
1280x940 pixel
41KB
600x441 pixel
15KB
1280x940 pixel
53KB
600x441 pixel
25KB
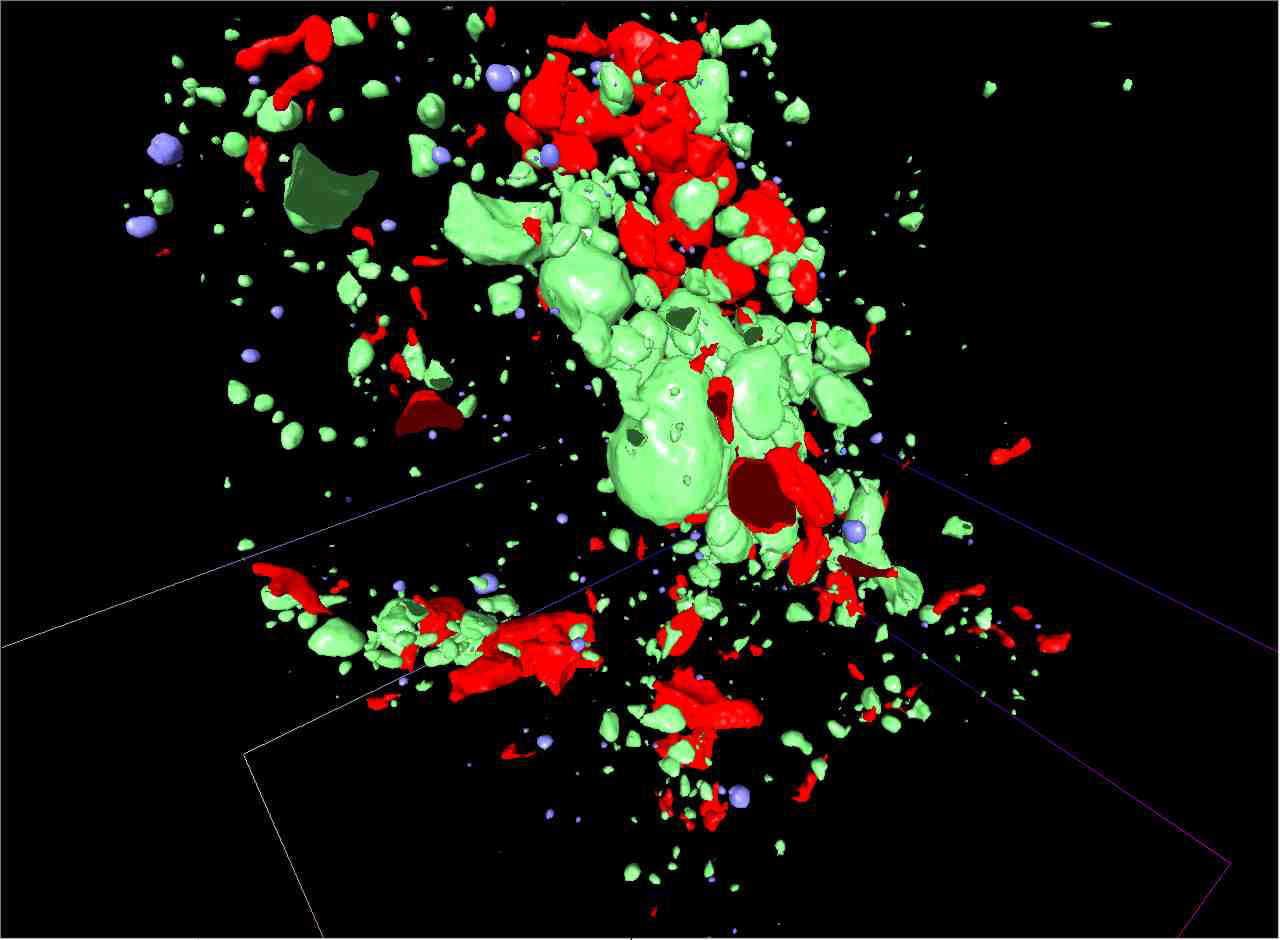
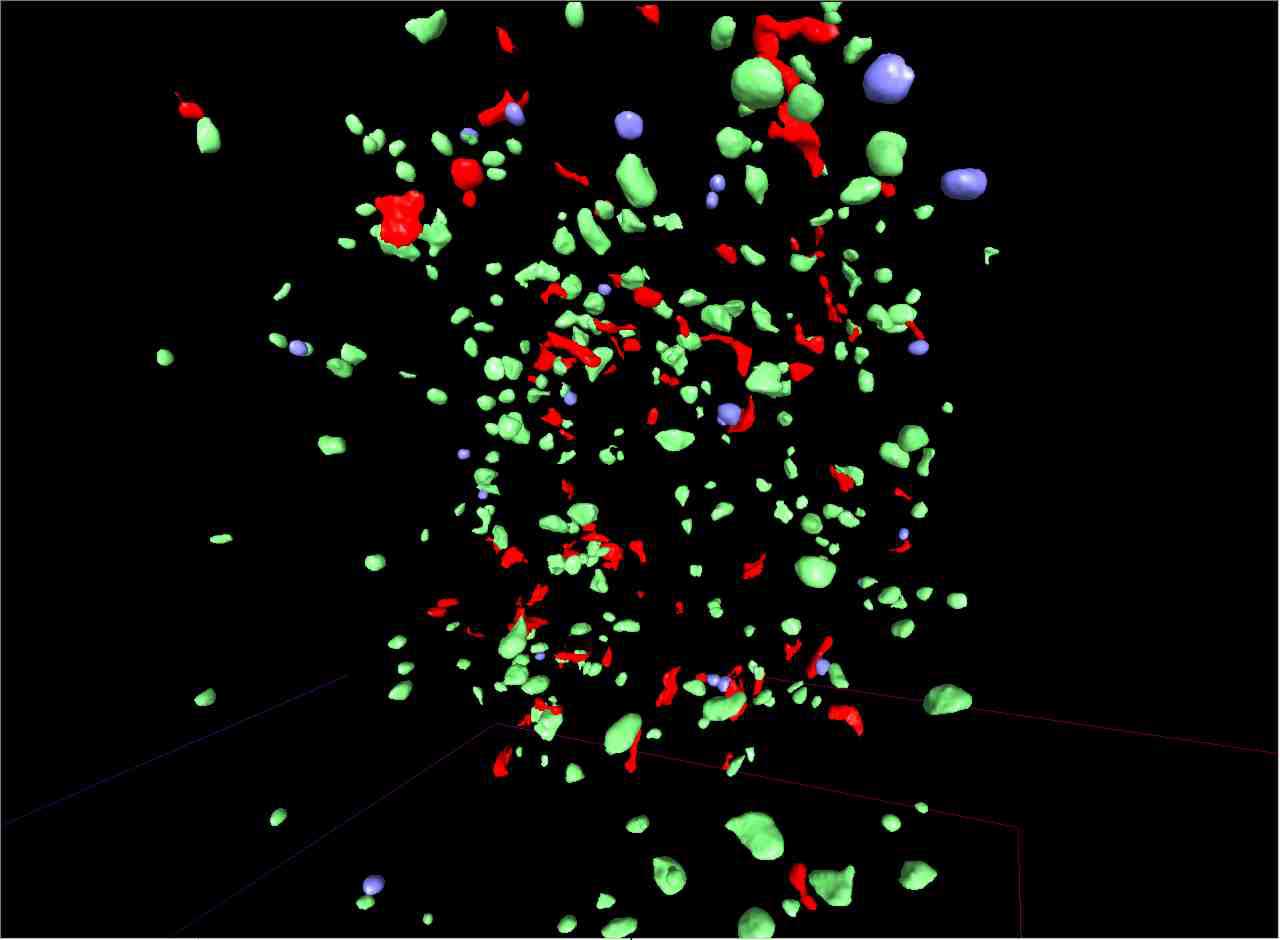
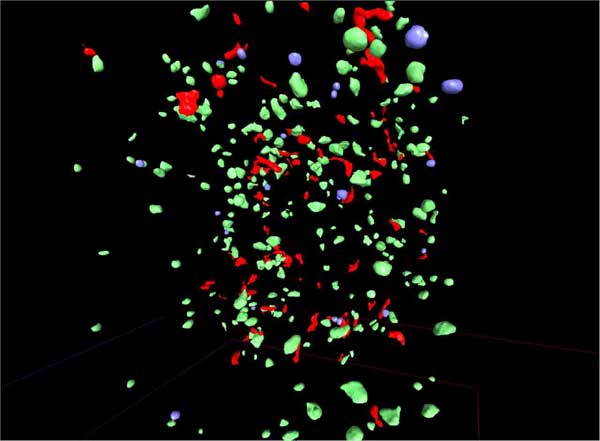
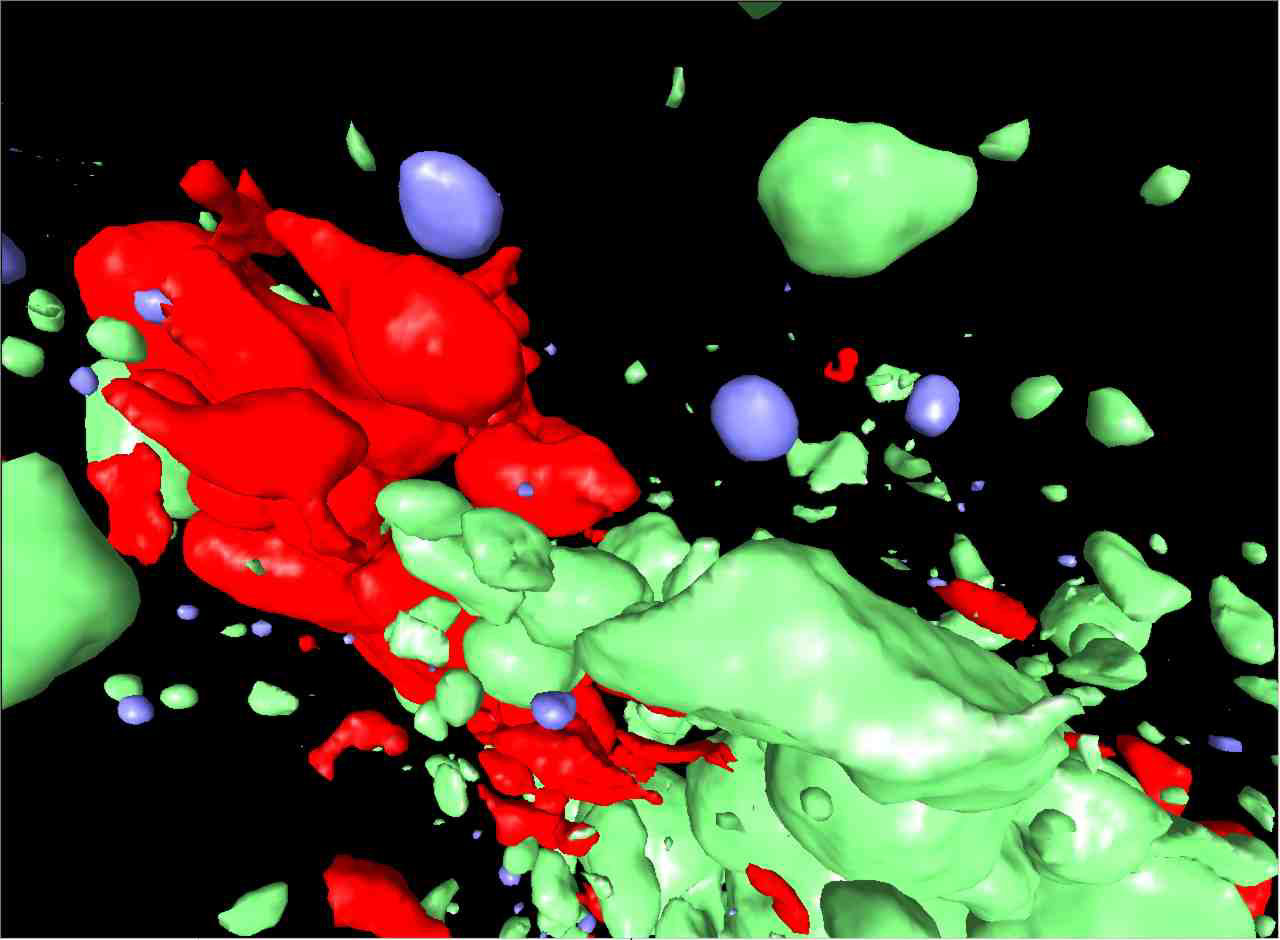
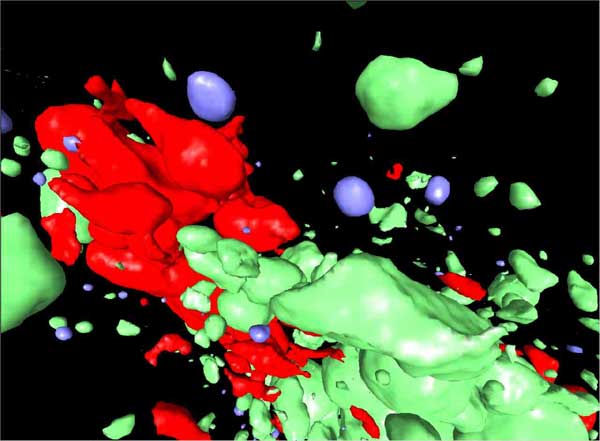
Focused view based on shape of cells
Blue cells: close to the shape of a sphere, small value of shape criterion f; green: medium value of f; red: large value of f.
1280x940 pixel
124KB
600x441 pixel
31KB