

Johannes Kehrer
Interactive Visual Analysis of Multi-faceted Scientific Data
Supervisor: Helwig Hauser
Duration: December 2007 — March 2011
[ Slides] [
 Thesis]
Information
- Visibility: hidden
- Publication Type: PhD-Thesis
- Workgroup(s)/Project(s): not specified
- Date: March 2011
- Date (Start): December 2007
- Date (End): March 2011
- TU Wien Library:
- Second Supervisor: Eduard Gröller
- 1st Reviewer: Prof. Heidrun Schumann
- 2nd Reviewer: Prof. Min Chen
- Rigorosum: May 27, 2011
- First Supervisor: Helwig Hauser
Abstract
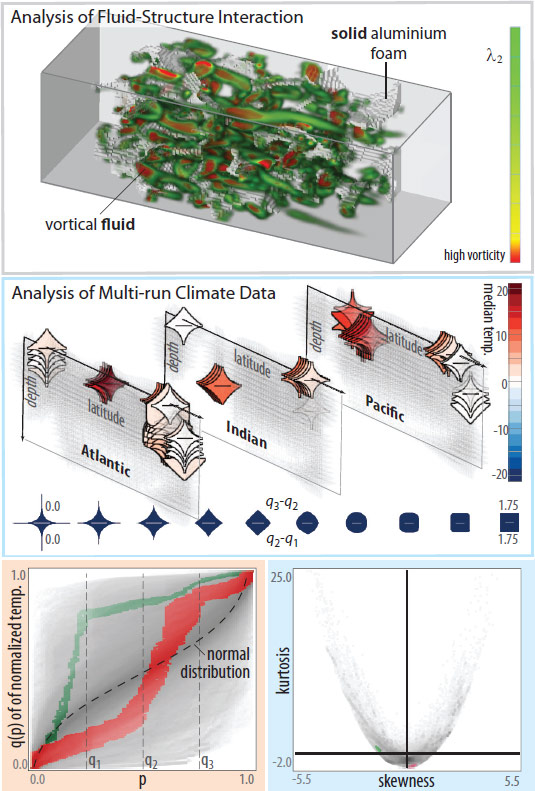
Visualization plays an important role in exploring, analyzing and presenting large and heterogeneous scientific data that arise in many disciplines of medicine, research, engineering, and others. We can see that model and data scenarios are becoming increasingly multi-faceted: data are often multi-variate and time-dependent, they stem from different data sources (multi-modal data), from multiple simulation runs (multi-run data), or from multi-physics simulations of interacting phenomena that consist of coupled simulation models (multi-model data). The different data characteristics result in special challenges for visualization research and interactive visual analysis. The data are usually large and come on various types of grids with different resolution that need to be fused in the visual analysis.This thesis deals with different aspects of the interactive visual analysis of multi-faceted scientific data. The main contributions of this thesis are: 1) a number of novel approaches and strategies for the interactive visual analysis of multi-run data; 2) a concept that enables the feature-based visual analysis across an interface between interrelated parts of heterogeneous scientific data (including data from multi-run and multi-physics simulations); 3) a model for visual analysis that is based on the computation of traditional and robust estimates of statistical moments from higher-dimensional multi-run data; 4) procedures for visual exploration of time-dependent climate data that support the rapid generation of promising hypotheses, which are subsequently evaluated with statistics; and 5) structured design guidelines for glyph-based 3D visualization of multi-variate data together with a novel glyph. All these approaches are incorporated in a single framework for interactive visual analysis that uses powerful concepts such as coordinated multiple views, feature specification via brushing, and focus+context visualization. Especially the data derivation mechanism of the framework has proven to be very useful for analyzing different aspects of the data at different stages of the visual analysis. The proposed concepts and methods are demonstrated in a number of case studies that are based on multi-run climate data and data from a multi-physics simulation.
Additional Files and Images


Weblinks
No further information available.BibTeX
@phdthesis{Kehrer-2011-PhD,
  title =      "Interactive Visual Analysis of Multi-faceted Scientific Data",
  author =     "Johannes Kehrer",
  year =       "2011",
  abstract =   "Visualization plays an important role in exploring,
               analyzing and presenting large and heterogeneous scientific
               data that arise in many disciplines of medicine, research,
               engineering, and others.  We can see that model and data
               scenarios are becoming increasingly multi-faceted:  data are
               often multi-variate and time-dependent, they stem from
               different data sources (multi-modal data), from multiple
               simulation runs (multi-run data), or from multi-physics
               simulations of interacting phenomena that consist of coupled
               simulation models (multi-model data).  The different data
               characteristics result in special challenges for
               visualization research and interactive visual analysis.  The
               data are usually large and come on various types of grids
               with different resolution that need to be fused in the
               visual analysis.  This thesis deals with different aspects
               of the interactive visual analysis of multi-faceted
               scientific data.  The main contributions of this thesis are:
                1) a number of novel approaches and strategies for the
               interactive visual analysis of multi-run data;  2) a concept
               that enables the feature-based visual analysis across an
               interface between interrelated parts of heterogeneous
               scientific data (including data from multi-run and
               multi-physics simulations);  3) a model for visual analysis
               that is based on the computation of traditional and robust
               estimates of statistical moments from higher-dimensional
               multi-run data;  4) procedures for visual exploration of
               time-dependent climate data that support the rapid
               generation of promising hypotheses, which are subsequently
               evaluated with statistics;  and 5) structured design
               guidelines for glyph-based 3D visualization of multi-variate
               data together with a novel glyph.  All these approaches are
               incorporated in a single framework for interactive visual
               analysis that uses powerful concepts such as coordinated
               multiple views, feature specification via brushing, and
               focus+context visualization.  Especially the data derivation
               mechanism of the framework has proven to be very useful for
               analyzing different aspects of the data at different stages
               of the visual analysis.  The proposed concepts and methods
               are demonstrated in a number of case studies that are based
               on multi-run climate data and data from a multi-physics
               simulation.",
  month =      mar,
  address =    "Favoritenstrasse 9-11/E193-02, A-1040 Vienna, Austria",
  school =     "Institute of Computer Graphics and Algorithms, Vienna
               University of Technology ",
  URL =        "https://www.cg.tuwien.ac.at/research/publications/2011/Kehrer-2011-PhD/",
}