

Ove Daae Lampe, Johannes Kehrer, Helwig Hauser
Visual Analysis of Multivariate Movement Data Using Interactive Difference Views
In Proceedings of Vision, Modeling, and Visualization (VMV 2010), pages 315-322. 2010.
Information
- Visibility: hidden
- Publication Type: Conference Paper
- Workgroup(s)/Project(s):
- Date: 2010
- Lecturer: Ove Daae Lampe
- Booktitle: Proceedings of Vision, Modeling, and Visualization (VMV 2010)
- Pages: 315 – 322
Abstract
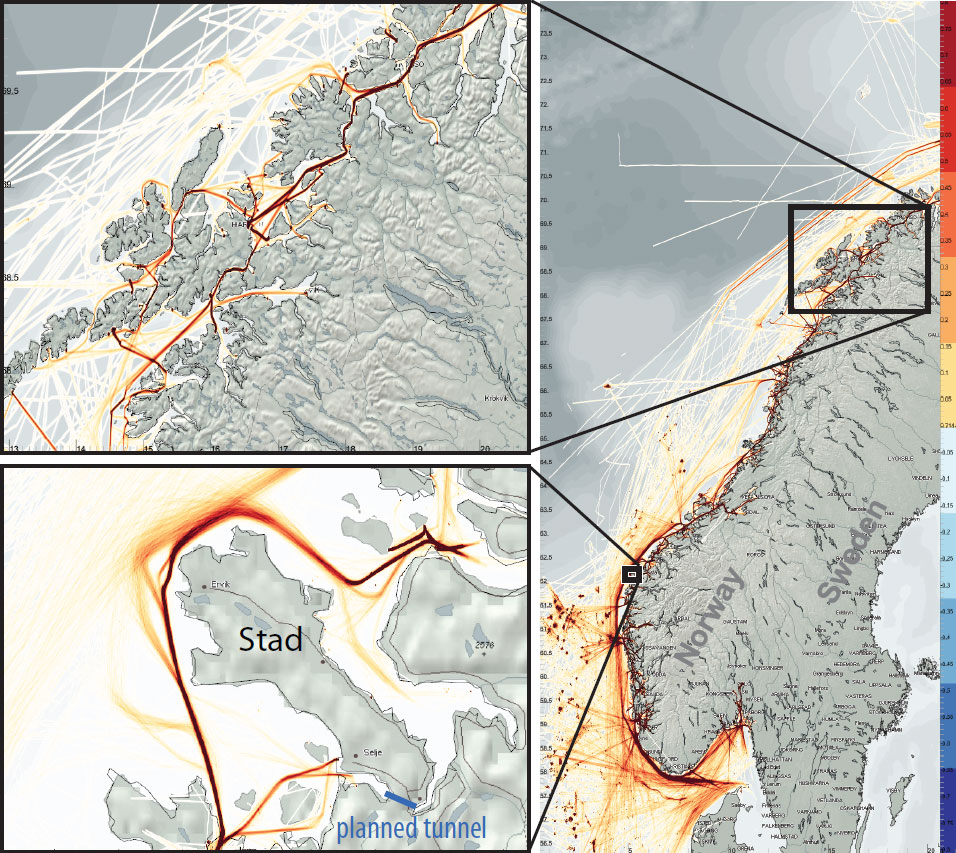
Movement data consisting of a large number of spatio-temporal agent trajectories is challenging to visualize, especially when all trajectories are attributed with multiple variates. In this paper, we demonstrate the visual exploration of such movement data through the concept of interactive difference views. By reconfiguring the difference views in a fast and flexible way, we enable temporal trend discovery. We are able to analyze large amounts of such movement data through the use of a frequency-based visualization based on kernel density estimates (KDE), where it is also possible to quantify differences in terms of the units of the visualized data. Using the proposed techniques, we show how the user can produce quantifiable movement differences and compare different categorical attributes (such as weekdays, ship-type, or the general wind direction), or a range of a quantitative attribute (such as how two hours’ traffic compares to the average). We present results from the exploration of vessel movement data from the Norwegian Coastal Administration, collected by the Automatic Identification System (AIS) coastal tracking. There are many interacting patterns in such movement data, both temporal and other more intricate, such as weather conditions, wave heights, or sunlight. In this work we study these movement patterns, answering specific questions posed by Norwegian Coastal Administration on potential shipping lane optimizations.Additional Files and Images
Weblinks
No further information available.BibTeX
@inproceedings{daae-lampe-2010-dif,
  title =      "Visual Analysis of Multivariate Movement Data Using
               Interactive Difference Views",
  author =     "Ove Daae Lampe and Johannes Kehrer and Helwig Hauser",
  year =       "2010",
  abstract =   "Movement data consisting of a large number of
               spatio-temporal agent trajectories is challenging to
               visualize, especially when all trajectories are attributed
               with multiple variates. In this paper, we demonstrate the
               visual exploration of such movement data through the concept
               of interactive difference views. By reconfiguring the
               difference views in a fast and flexible way, we enable
               temporal trend discovery. We are able to analyze large
               amounts of such movement data through the use of a
               frequency-based visualization based on kernel density
               estimates (KDE), where it is also possible to quantify
               differences in terms of the units of the visualized data.
               Using the proposed techniques, we show how the user can
               produce quantifiable movement differences and compare
               different categorical attributes (such as weekdays,
               ship-type, or the general wind direction), or a range of a
               quantitative attribute (such as how two hours’ traffic
               compares to the average). We present results from the
               exploration of vessel movement data from the Norwegian
               Coastal Administration, collected by the Automatic
               Identification System (AIS) coastal tracking. There are many
               interacting patterns in such movement data, both temporal
               and other more intricate, such as weather conditions, wave
               heights, or sunlight. In this work we study these movement
               patterns, answering specific questions posed by Norwegian
               Coastal Administration on potential shipping lane
               optimizations.",
  booktitle =  "Proceedings of Vision, Modeling, and Visualization (VMV
               2010)",
  pages =      "315--322",
  URL =        "https://www.cg.tuwien.ac.at/research/publications/2010/daae-lampe-2010-dif/",
}