Collaborative Augmented Reality: Exploring Dynamical Systems
Anton Fuhrmann, Helwig Löffelmann, Dieter Schmalstieg
Vienna University of Technology
Institute of Computer Graphics
Abstract
In this paper we present collaborative scientific visualization in Studierstube. Studierstube is an augmented reality system that has several advantages over conventional desktop and other virtual reality environments, including true stereoscopy, 3D-interaction, individual viewpoints and customized views for multiple users, unhindered natural collaboration and low cost. We demonstrate the application of this concept for the interaction of multiple users and illustrate it with several visualizations of dynamical systems in DynSys3D, a visualization system running on top of AVS.
As a highly interdisciplinary field, scientific visualization frequently requires experts with different background to cooperate closely. Many valuable insights only occur in face-to-face discussions over the relevant data.
To preserve these valuable aspects, we propose an augmented reality (AR) system which combines a familiar physical surrounding with the visualization of the synthetic data. The intrinsic advantage of AR, namely the superimposition of computer-generated images over the users view of reality enables unique combinations of real and virtual objects and the unhindered cooperation of different users viewing the same visualization.
We also show how the integration of AR into a visualization system [AVS92], can be achieved so that the Studierstube becomes a three-dimensional user interface for scientific visualizations. Several examples constructed in DynSys3D [Löff97a] - developed for the visualization of complex dynamical systems in AVS - will complement the presentation.
Early adopters of virtual reality (VR) systems soon realized that one of the immediately useful applications comes from the field of scientific visualization, where scientists try to understand complex data sets and can benefit from true 3D, stereoscopy, and interactive exploration, e.g., GROPE [Broo90], the nanomanipulator [Tayl93], and the virtual Windtunnel [Brys91]. The need to support collaboration of human users lead in two directions: remote collaboration (e.g. [Brys93]) and collaborative virtual environments (VEs) where users come together in one place, and can interact and communicate in a natural way.
In the latter category, two very successful approaches have been developed: The CAVE [Cruz93], and the workbench, with two variants - Responsive Workbench [Krüg95] and Virtual Workbench (VW) [Obey96]. Both systems present stereoscopic images to the user via large display screens and LCD shutter glasses, and both systems support multiple users.
The CAVE is a small room composed of three projection walls and a projection floor, on which computer-generated images are displayed. Among the CAVE's advantages are high resolution, wide field of view, insensitivity towards lag for rotational head movements, and a strong feeling of immersion.
The Workbench is essentially a table on which computer generated images are projected, resulting in a typical setup used by e.g. surgeons, engineers and architects. The resource requirements are less demanding than those of the CAVE, and the horizontal workspace is very useful for manipulation with hand-held tools.
Both systems suffer from the drawback that true stereoscopic images can only be rendered for one "leading" user wearing the head tracker - the users have to remain close to the leading user, because distortions increase proportional to their distance to the tracked point of view. Applications in which users surround an object don't work in the CAVE and are only possible for two participants in the latest version of the Workbench [Cybe97].
We propose a system that allows multiple collaborating users to simultaneously study three-dimensional scientific visualizations in a "study room" - German: "Studierstube" (inspired by the classic play "Faust"). Each participant wears an individually head-tracked see-through HMD providing a stereoscopic real-time display (
The use of individual displays and head-tracking for each participant allows stereoscopic, undistorted images to be presented to everyone. There are no constraints regarding the viewpoint, e.g., unlike the Workbench, users may sit on opposite sides of the table, which in combination with the see-through property of the HMDs allow users to see each other. This also avoids the fear of bumping into obstacles which often limits the freedom of movement in purely immersive setups. The HMDs we use - Virtual I-O i-glasses - are very lightweight and unobtrusive, but only of limited resolution and small (30°) field of view. Rendering separate images for each user gives great flexibility in the choice of the presented image, but also makes the rendering effort proportional to the number of users, whereas CAVE and (single-user) Workbench require only a constant rendering effort.
The defining features of Studierstube are:
Augmented props: We exploit the capabilities of AR to construct a three-dimensional user interface needed for controlling the presentation and possibly the simulation by introducing tracked real-world objects that combine physical items and overlaid computer graphics, such as the Personal Interaction Panel (PIP) [Szal97]. The PIP is used as a device for handling virtual objects (
color plate 5) or as a cutting plane.Customized views: In addition to individual choice of viewpoint, customized views of the data are possible, e.g., one user may want to see stream lines added to the basic image, while another may not. Two users in the same room may see different aspects of the same object at the same time.
Usage of space: The space in the Studierstube can be used similarly to a CAVE (multiple users standing around), but also allows a workbench setup (users gathering at a blank table with free choice of seating).
Organizational advantages: While the cost of the Studierstube's hardware components are certainly higher than a conventional desktop visualization station consisting of only a graphics workstation, they are very conservative compared to a setup like the CAVE. This is particularly important as the potential users of the Studierstube - research groups - are typically operating on a tight budget. Furthermore, the setup consumes little space and is relatively easy transportable.
To combine augmented reality and scientific visualization, a new integrated solution could be developed, but employing an existing, general-purpose scientific visualization system (in our case, AVS) allows a wider range of applications and eases development. Since this desktop-based system is not designed for the real-time requirements of AR, we use what Shaw et al. call a decoupled simulation [Shaw93]: The visualization system and the AR user interface (called display server in an analogy to X-Windows) run as completely independent processes, typically executing on separate machines and communicating with each other over a network.
As shown in figure 1, the system is composed of two loops: the display loop, a tightly coupled human-in-the-loop component, where real-time response is essential, and a loose coupling between display server and visualization application for the exchange of visual information. The display server continues to serve real-time graphics to the user while the application may work in background, delays of several seconds for recomputation are quite acceptable.
Figure 1: Decoupled simulation model
The display server is a multi-threaded application: Rendering the HMD images from the geometry database and transferring data to and from AVS execute simultaneously. Local interaction such as positioning and rotating the virtual objects is done by interacting with the display server, and does not affect the visualization system. Input from the HMDs and interaction devices is delivered to the display server by a dedicated tracker demon, which runs on a separate machine. The display server also forwards user commands to AVS and receives updates to the geometry database (figure 2).
Figure 2: Display server and hardware configuration
DynSys3D is a multi-purpose workbench for the rapid development of advanced visualization techniques [Löff97b, Löff97c] in the field of three-dimensional dynamical systems, designed to support incremental and parallel implementations of new ideas in this field.
The system is based on AVS [AVS92], which is a general purpose visualization system based on data flow paradigm.
DynSys3D modules are usually built from at least three principal components: Dynamical System, Numerical Integrator, and Visualization Technique. They are separated by rather narrow interface specifications. By this separation, for example, new dynamical systems can be visualized with approved visualization techniques without recompiling them. Similarly, a new numerical integrator can be plugged into this system without touching any visualization module. Currently, the most important visualization icons, e.g., streamlines and streamsurfaces, and a set of specialized modules exist.
One design guideline of DynSys3D, namely that all of its modules have to produce standard AVS output (geometry), was very important for the integration of DynSys3D and Studierstube: A simple conversion utility that converts AVS geometry into the Studierstube's format (Open Inventor) was sufficient to export geometry. Interaction messages from the VE are sent to DynSys3D's input modules as AVS geometry items, e.g. points for 3D mouse positions, lines for 3D mouse drag events (
color plates 2-4).Governed by the data flow paradigm underlying AVS, the user's commands are routed via the display server to input modules of an AVS network, whereas the results of the computation are sent to output modules, and from there onward to the user (figure 3). However, AVS' execution scheme invokes modules only when the user generates input events. Consequently, the network communication with the display server had to be implemented as a coroutine inside AVS, which forwards the user's commands to an AVS input module. This explicitly triggers re-evaluation of the AVS net; the coroutine also collects the results (usually new or modified geometric data) and forwards it to the display server.
Figure 3: AVS/DynSys3D configuration
The following DynSys3D applications were selected as representative examples for the evaluation of our concept.
A model we investigated together with colleagues from our econometrics department is the 3D autocatalator [Mili96, Petr92]. It is a simple 3D dynamical system which exhibits mixed-mode oscillations. These are phenomena often encountered in real world systems, e.g., chemical systems. Depending on the parameters of this system either periodic or quasiperiodic (chaotic) solutions can be found. To investigate the behavior induced by this dynamical system it is very helpful to explore the 3D phase space directly by getting immersed into the VE. Structure and relations of visualization icons that are produced by the visualization system can be better investigated through 3D interaction. Furthermore the direct control on placing streamlines or streamsurfaces makes it much more intuitive to analyze a given parameter set.
RTorus is a 'synthetic' dynamical system which is very useful for demonstrating certain properties that are common to lots of others. Abraham and Shaw use this model as an example to explain several fundamental flow properties [Abra92]. This dynamical system models a coupled oscillation within three-space. Depending on the parameters of the model either an attracting cycle within the x-y-plane or an attracting torus around the z-axis appears. Lots of interesting settings of RTorus can be found as, e.g., the Möbius band. RTorus can be especially well investigated within Studierstube. Due to the interactive repines details can be obtained that would require long-term adjustments using the standard AVS interface. Intuitive interaction techniques allow to adaptively position and adjust 'camera' parameters such that interesting properties can be seen optimally.
As a rather well-known dynamical system we also investigated the Rössler attractor in Studierstube. Rössler is also a three-dimensional dynamical system that exhibits a chaotic attractor if parameters are set properly. Taking this familiar dynamical system for analysis in Studierstube allowed us to easily compare visualization in AR to established techniques.
Our evaluation showed that the investigation of dynamical systems in the Studierstube has some significant advantages:
Rapid feedback for visualization mapping. It has been seen that the fast feedback loop allowing to trigger new calculations of the visualization mapping, e.g., the integration of a streamsurface from within the AR setup, speeds up and enhances the visualization and understanding process. The process of choosing an initial visualization mapping, then refining it converges much faster as researcher are better able to estimate their requirements.
Reduced abstraction. Abstract mathematical constructs such as phase space, attractors etc. can be deterring in their complexity even for experts. The intuitive 3D user interface of Studierstube greatly simplifies the exploration of these structures and allows the user to get familiar with the 3D representation of the dynamical systems much faster than via a 2D display.
Educational settings. The collaborative setting of Studierstube is of great utility for explaining dynamical systems. Tutorial situations are strongly supported by the capability to freely choose ones viewpoint and the unhindered natural communication. The very concrete, true 3D representation especially benefits students that are unfamiliar with complex mathematical structures.
Customized views. When multiple researchers investigate dynamical systems together, Studierstube's capability of separating customized views allows individual markers and visualization icons to be added. These icons can be kept private to avoid display clutter, or they can be shared with others.
Enhanced interaction capabilities. We have verified that true three-dimensional viewing and manipulation is indeed superior to screen-and-mouse based interaction of complex 3D models. The tedious work of positioning, orienting, and zooming, typical for conventional systems, can be reduced significantly. Alternatives in the operation (e.g. moving ones head vs. rotating the object) make exploration less computer-centric and are easy to learn for inexperienced users.
By connecting the AR system Studierstube and the visualization system DynSys3D we started a synergistic effect: Researchers who investigate dynamical systems profit from the intuitive interaction techniques available for 3D phase space in Studierstube, and also from the collaborative setting. From an AR researcher's perspective, the behavior and demands of "real" users (designers of dynamical systems) supported the development of Studierstube as a practical tool, and also permitted us to verify that useful work can be done in such a setup.
While performance was more or less satisfactory for most tasks, we quickly learned that the intuitive operation of the system fuels the imagination, and makes researchers demand visualization that are more complex in structure and detail, so they quickly exceed the rendering subsystems real-time capabilities. To allow the system to reach further, optimizations and support for levels of detail is definitely on the list for future work.
This work has been supported by the Austrian Science Foundation (FWF) under project no. P-12074-MAT.
[Abra92] Dynamics - The Geometry of Behavior. Addison-Wesley, 1992.
[AVS92] AVS Developers Guide - Release 4. Advanced Visualisation Systems Inc, 1992.
[Broo90] F. Brooks Jr. et. al.: Project GROPE - Haptic Displays for Scientific Visualisation. Proceedings of SIGGRAPH'90, pp 177-185, 1990.
[Brys91] S. Bryson: The Virtual Wind Tunnel. Proceedings of IEEE Visualization'91, 17-25, 1991.
[Brys93] S. Bryson: The Distributed Virtual Windtunnel. SIGGRAPH'93 Course Notes 43, 3.1-3.10, 1993.
[Cybe97] CyberEdge Journal issue#35, Jan/Feb 97, pp23: VR Products: DUO-Dynamic Display System
[Cruz93] C. Cruz-Neira, D. Sandin, T. DeFanti: Surround-Screen Projection-Based Virtual Reality: The Design and Implementation of the CAVE. Proc. of SIGGRAPH'93, 135-142, 1993.
[Krüg95] W. Krüger et al: The Responsive Workbench: A Virtual Work Environment. IEEE Computer 28(7): 42-48, 1995.
[Löff97a] Löffelmann H., Gröller E.:
DynSys3D: A workbench for developing advanced visualization techniques in the field of three-dimensional dynamical systems. WSCG'97, Plzen, Czech Republic, pp. 301-310, 1997.[Löff97b] H. Löffelmann, L. Mroz, E. Gröller:
Hierarchical Streamarrows for the Visualization of Dynamical Systems. To appear in: Proc. of the 8th Eurographics Workshop on Vis. in Sci. Computing, April 1997[Löff97c] H. Löffelmann, E. Gröller:
Visualizing Poincaré Maps together with the underlying flow.[Mili96] A. Milik: Dynamics of Mixed-mode Oscillations. PhD thesis, Vienna U. of Technology, Austria, 1996.
[Obey96] U. Obeysekare et al.: Virtual Workbench - A Non-ImmersiveVirtual Environment for Visualizing and Interacting with 3D Objects for Scientific Visualization. Proceedings of Visualization'96, pp. 345-350, 1996.
[Petr92] V. Petrov, S. Scott, K. Showalter: Mixed-mode oscillations in chemical systems. Journal of Chemical Physics, Vol. 97, No. 9, pp. 6191-6198, 1992.
[Shaw93] C. Shaw, et al: Decoupled simulation in virtual reality with the MR toolkit. ACM Transactions on Information Systems, Vol. 11, No. 3, pp. 287-317, 1993.
[Szal97] Zs. Szalavári, M. Gervautz: The Personal Interaction Panel - A Two-handed Interface for Augmented Reality. To appear in: Proc. EUROGRAPHICS'97, Budapest, Hungary, 1997.
[Tayl93] R. Taylor et. al.: The Nanomanipulator: A Virtual Reality Interface for a Scanning Tunneling Microscope. Proceedings of SIGGRAPH'93, pp. 127-134, 1993.
plate 1: hardware configuration of Studierstube (displaying Rössler attractor)
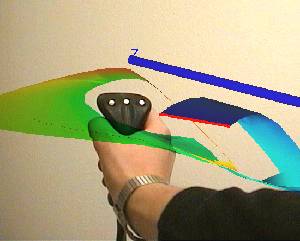
plate 2: injecting a new streamsurface into MMO - button down
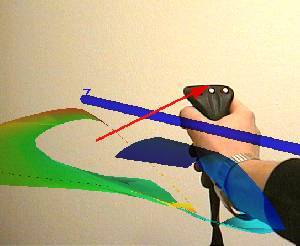
plate 3: drawing the seedline (note red "rubberband")
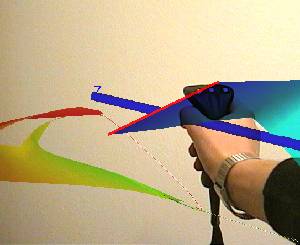
plate 4: button release - geometry updated
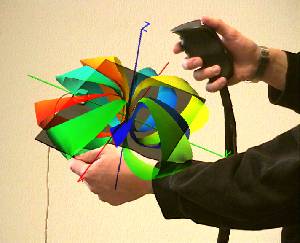
plate 5: investigating RTorus on PIP (two-handed interaction)