project duration: 1994-1995
Given a one-dimensional time series x[i] one would like to know if this sequence of discrete values is the result of some nonlinear dynamical system. Plotting sequence x[i] over time may not reveal the underlying structure. There are, however, techniques which allow to determine the nonlinear dynamics of a system, even if the only information on the dynamical system is given by the values of a single state variable at discrete points in time. This means that one does not need to know all the state variables of the original system. The dynamical behavior is already encoded, more ore less completely, in one state variable. These so called reconstruction techniques take a one-dimensional time series x[i] and construct a higher-dimensional reconstruction space by defining a derived time series y[i]=(x[i], x[i+T], x[i+2T], ..., x[i+2NT]). T is called the delay time of the reconstruction process. If the dimension of the underlying attractor is not larger than N then taking the dimension of reconstruction space to be 2N+1 is sufficient to get a (distorted) copy of the original attractor in reconstruction space.
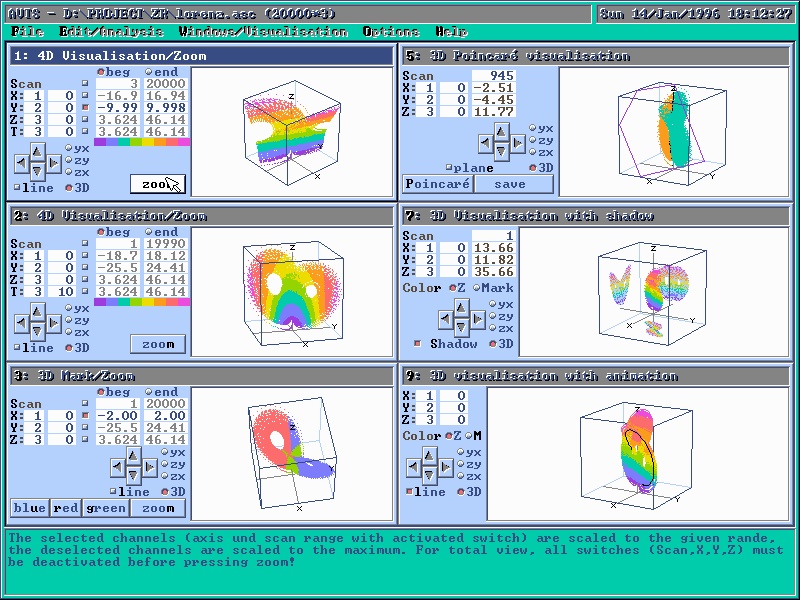
AVTS ("Analysis and Visualization of Time Sequences" implemented by Anton Kirchsteiger) is an interactive program for investigation and manipulation of one and higher-dimensional time series. The data is given in table form in an ASCII file. The rows of the table (number of data points of the time series) are called "scans", the columns (dimensionality of the time series, number of data values for one data point) are called "channels". The time series is displayed as a point set in several windows on the screen. The user may choose between a 3D plot with interactive specification of the viewing parameters or axis-aligned 2D plots (parallel projection into the yx-, zy-, or zx-plane). Zooming onto portions of a time series is realized by either marking a certain number of "scans" or by defining subintervals for the individual coordinate axes. Any "channel" can be assigned to the x-, y- and z-axis. Additionally a "scan" offset (time delay) for each axis specifies the first "scan" of the corresponding "channel" to be displayed. The same "channel" may be assigned to more than one axis. By using different "scan" offsets phase-space reconstructions due to a one-dimensional time series are feasible. The aim of the interactive program is to allow the researcher to quickly focus on interesting portions of his data. In the following step he may then use numerical tools for further analysis.
To download the software press AVTS (PC, Dos, Windows, uncompress with pkunzip, sample data included). Further information is given in the following technical reports:

This page is maintained by Eduard Gröller. It was last updated on November 20, 1998.
If you have any comments, please send a message to edi@cg.tuwien.ac.at.