
Abstract of the Paper:
|
| Non-photorealisic direct volume rendered animation of the peripheral vascular structure (.avi) |
|
| Rotating Maximum Intensity Projection of the peripheral vascular structure (.avi) |
|
| Rotating Curved Planar Reconstruction of an automatically tracked vessel (.mpg) |
|
| An animation of the vessel tracker process (.avi) |
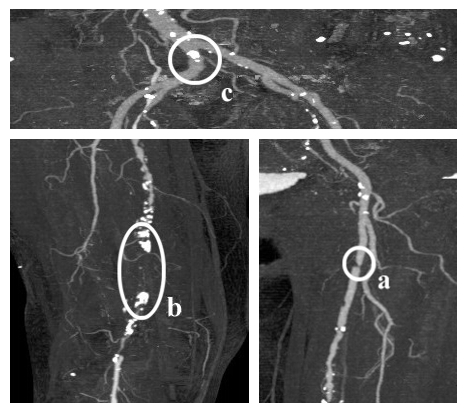 |
Figure 1
:
Different arterial diseases: Stenosis (a), Occlusion caused by calcification (b) and Calcification (c). |
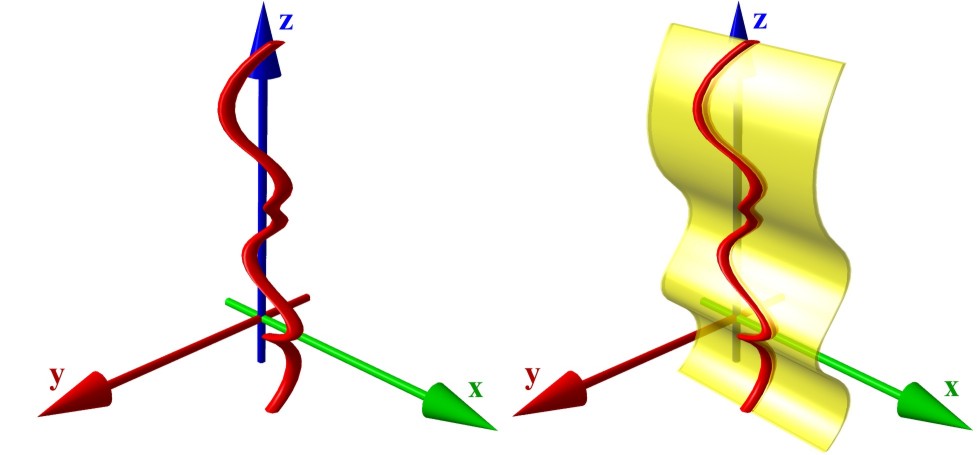
| Figure 2
:
Left: Vessel centerline (3D curve). Right: Curved plane in 3D space. | |
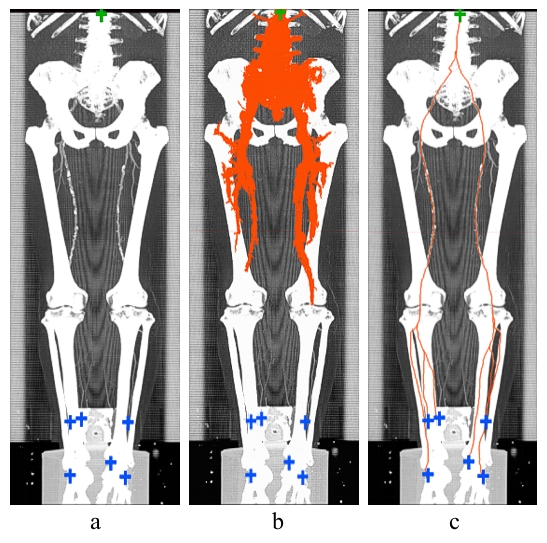 |
Figure 3
:
User-defined starting point (top) and endpoints (bottom) (a), path generation process (b) and calculated centered paths (c). |
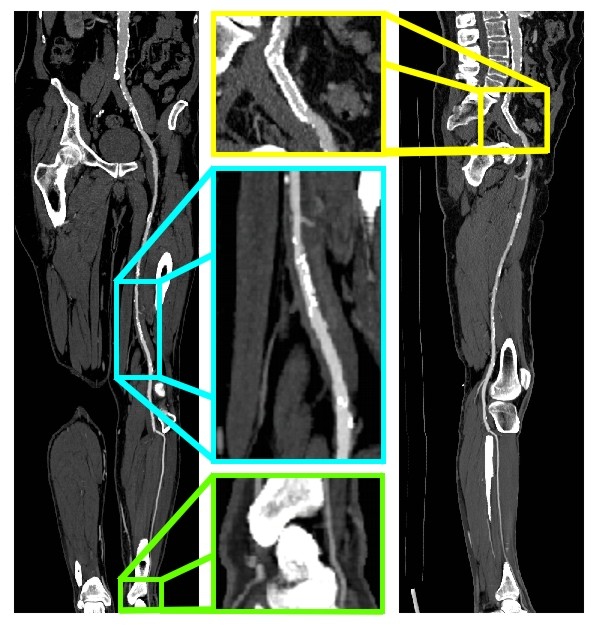 |
Figure 4
:
Coronar CPR (left side) and sagittal CPR (right side) of anterior tibial artery from the dataset in figure 3. |
 |
Figure
5 :
A MIP of a segmented dataset on the right side and a MIP of the corresponding dataset on the left side. |
 |
Figure 6
:
Evaluation of the results at the AKH-Wien. |
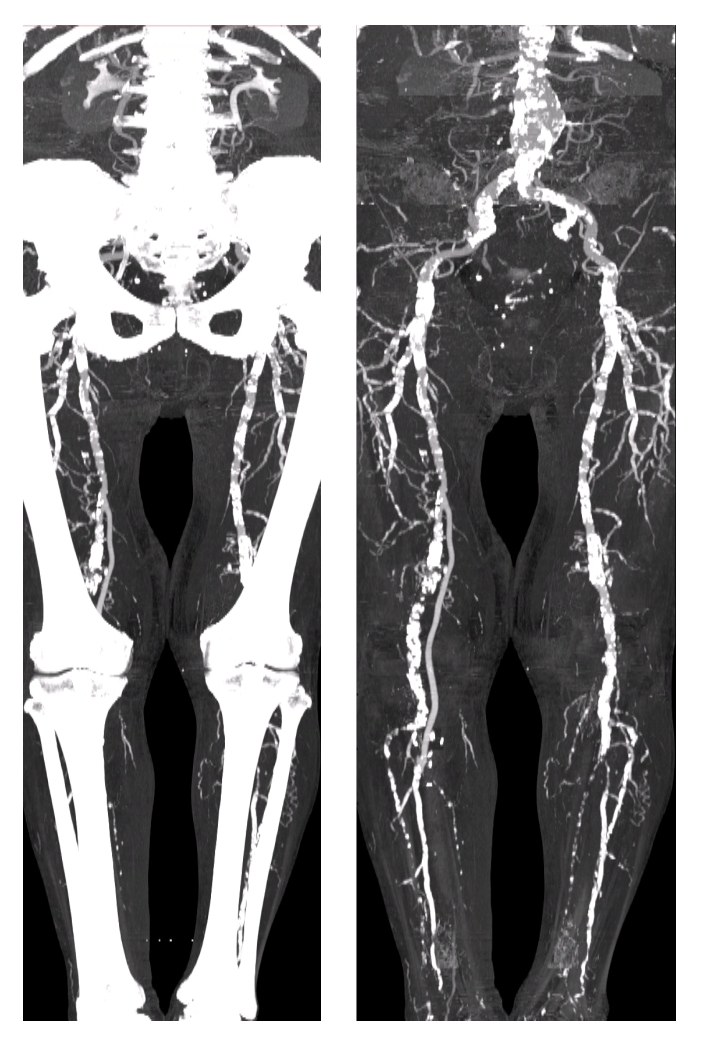 |
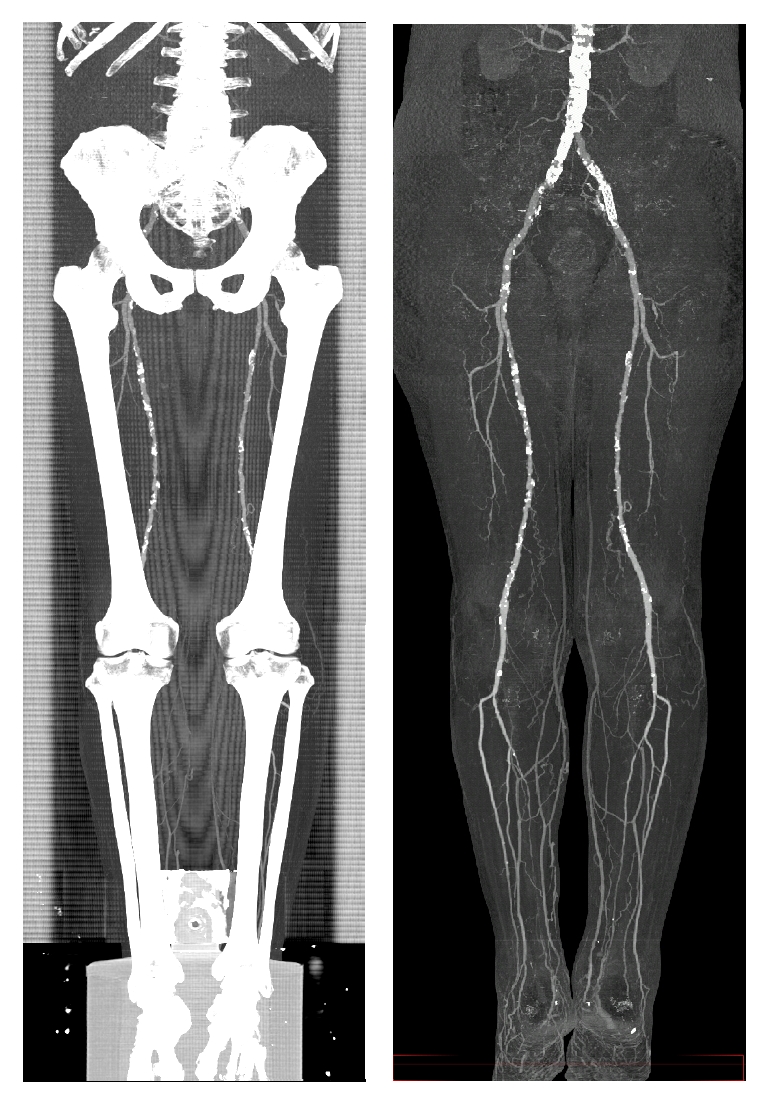
Figure 7
:
A sample dataset with heavy calcification. The MIP of the original dataset (left) and the segmented dataset (right) is presented in this figure. |
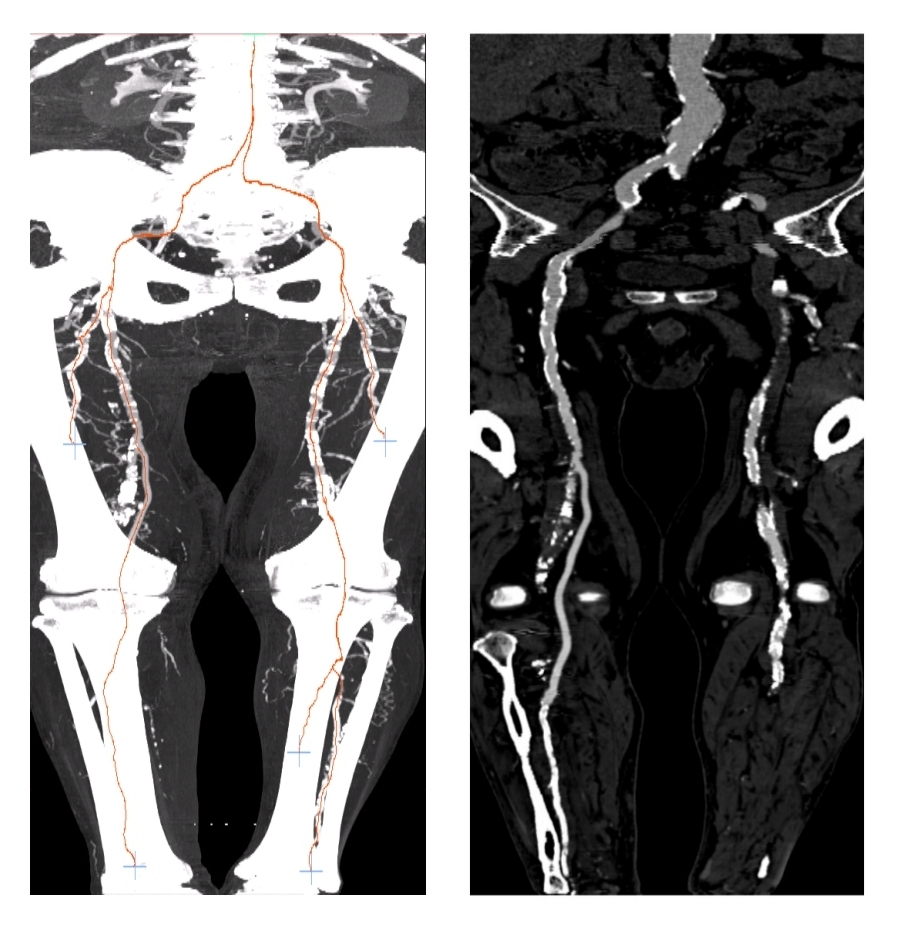 |
Figure
8
:
Computed paths with a CPR corresponding one of the paths. |
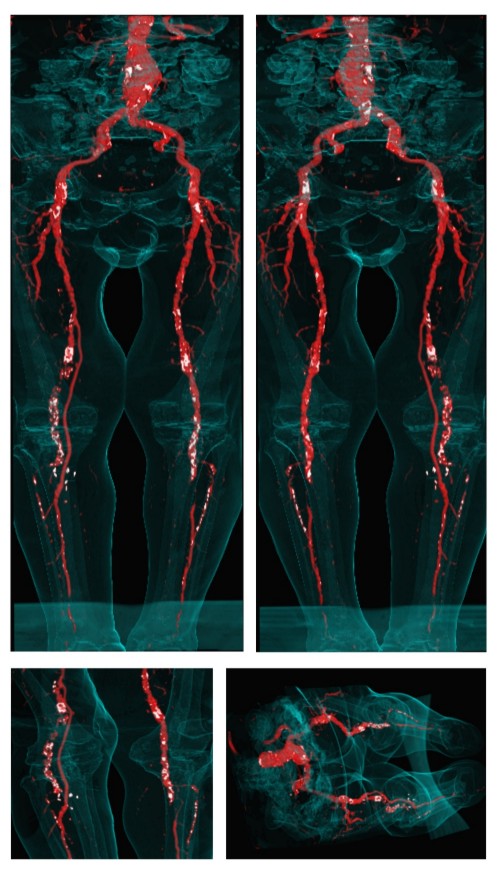 |
Figure
9
:
Non-photorealistic direct volume rendered images of the sample dataset. Calcifications and arteries are colored white and red. The outline of the body is visualized as guidance for the surgeon. |