Concept Clusters
[
 report]
Dominik Wolf
Concept Clusters
[report]
Pavol Ulbrich, Manuela Waldner , Katarína Furmanová, Sergio M. Margues, David Bednář, Barbora Kozlikova, Jan Byska
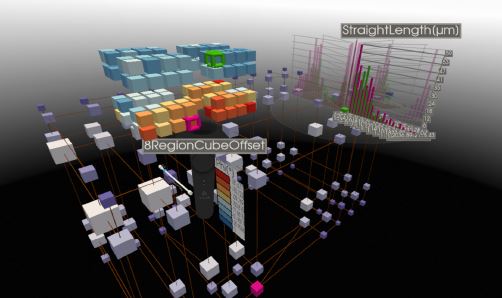
sMolBoxes: Dataflow Model for Molecular Dynamics Exploration
IEEE Transactions on Visualization and Computer Graphics:1-10, October 2022. [arxiv]
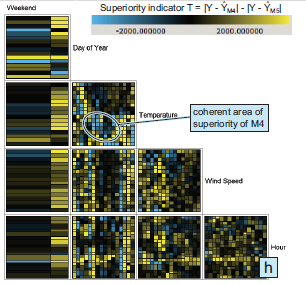
Ádam Böröndy, Katarína Furmanová, Renata Raidou
Understanding the impact of statistical and machine learning choices on predictive models for radiotherapy.
In Eurographics Workshop on Visual Computing for Biology and Medicine (VCBM2022), pages 65-69. September 2022.
[ paper]
Caroline Magg, Renata Raidou
Visual Analytics to Assess Deep Learning Models for Cross-Modal Brain Tumor Segmentation
In Eurographics Workshop on Visual Computing for Biology and Medicine (VCBM 2022), pages 111-115. September 2022.
Oliver Stritzel, Renata Raidou
Predicting, Analyzing and Communicating Outcomes of COVID-19 Hospitalizations with Medical Images and Clinical Data
In Eurographics Workshop on Visual Computing for Biology and Medicine (VCBM2022)., pages 129-133. September 2022.
Sandra Ortega-Martorell, Patrick Riley, I Olier, Renata Raidou, R Casana-Eslava, M Rea, L Shen, P.J. Lisboa, C Palmieri
Breast cancer patient characterisation and visualisation using deep learning and fisher information networks
Scientific Reports, 12, August 2022.
Maath Musleh, Angelos Chatzimparmpas, Ilir Jusufi
Visual analysis of blow molding machine multivariate time series data
Journal of Visualization, 25:1329-1342, July 2022. [ paper]
Nicolas Grossmann, Eduard Gröller, Manuela Waldner
Concept splatters: Exploration of latent spaces based on human interpretable concepts
Computers and Graphics, 105:73-84, April 2022. [ video] [paper] [online demo]
Daniel Lippeck
3D Graph Algorithm for Multilayer Network Analytics
[ thesis]
Stefan Sietzen
Visual Analytics for Convolutional Neural Network Robustness
[ Master thesis] [
 poster] [online playground]
Hannah Bayat
Multi-faceted Visual Analysis of Inter-Observer Variability
[ Master thesis]
Judith Louis-Alexandre Dit Petit-Frere
Visual Exploration of Indirect Biases in Natural Language Processing Transformer Models
[ Master thesis]
Sujoy Bhore, Guangping Li, Martin Nöllenburg, Ignaz Rutter, Hsiang-Yun Wu
Untangling Circular Drawings: Algorithms and Complexity
In Proceedings of the 32nd International Symposium on Algorithms and Computation, pages 1-17. December 2021.
Philip Bugnar
Exploratory Search Interface for Knowledge Databases
Maximilian Sbardellati
Exploratory Visual System for Predictive Machine Learning of Event-Organisation Data
[ poster] [
 thesis]
Eduard Gröller
Interactive Visual Data Analysis,
21. October 2021, Iasi, Romania
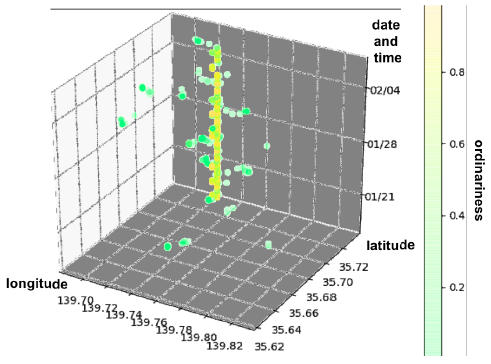
Marija Priselac
Visual Analytics of Spatial Time Series Data
[ image] [
 Master Thesis] [
 Poster]
Anja Heim, Eduard Gröller, Christoph Heinzl
CoSi: Visual Comparison of Similarities in High-Dimensional Data Ensembles
VMV: Vision, Modeling, and Visualization:1-8, October 2021. [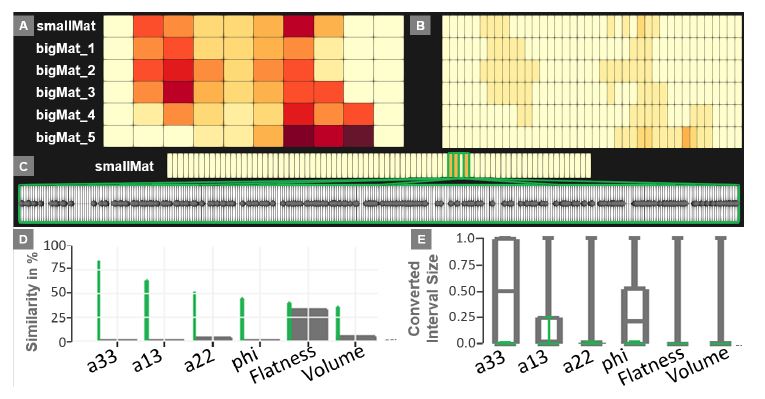 Image] [
 Paper]
Nicolas Grossmann, Jürgen Bernard, Michael Sedlmair, Manuela Waldner
Does the Layout Really Matter? A Study on Visual Model Accuracy Estimation
In IEEE Visualization Conference (VIS), pages 61-65. October 2021.
[ paper]
Stefan Sietzen, Mathias Lechner, Judy Borowski, Ramin Hasani, Manuela Waldner
Interactive Analysis of CNN Robustness
Computer Graphics Forum, 40:253-264, October 2021. [ paper] [
 video] [online tool]
Johannes Sorger, Alessio Arleo, Peter Kán, Wolfgang Knecht, Manuela Waldner
Egocentric Network Exploration for Immersive Analytics
Computer Graphics Forum, 40:241-252, October 2021. [ the paper] [
 video] [online egocentric network]
Mario Stoff
Concept Map Mining as Browser Extension
[ thesis]
Samo Kolter
Creating an Interactive Web App for Computer Graphics Topics
[ Bachelor thesis]
Tobias Batik, Soeren Nickel, Martin Nöllenburg, Yu-Shuen Wang, Hsiang-Yun Wu
Mixed Metro Maps with User-Specied Motifs
Poster shown at 29th International Symposium on Graph Drawing and Network Visualization
(14. September 2021-17. September 2021)
Francesca Gauci, Maath Musleh
Agritology: A Decision Support System for Local Farmers in Malta and Palestine
Poster shown at 3rd International Workshop on Semantics for Biodiversity (S4BioDiv)
(11. September 2021-18. September 2021)
Maath Musleh, Angelos Chatzimparmpas, Ilir Jusufi
Visual Analysis of Industrial Multivariate Time Series
In The 14th International Symposium on Visual Information Communication and Interaction, pages 1-5. September 2021.
Rebecca Nowak
Interactive Correlation Panels for the Geological Mapping of the Martian Surface
[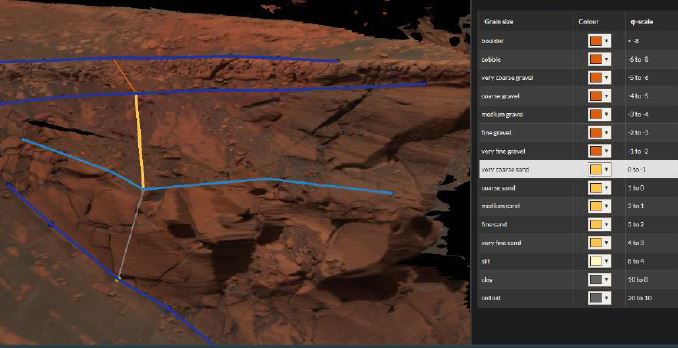 image] [
 Master Thesis] [
 Poster]
Christoph Heinzl
Visualization and Analysis of X-ray Computed Tomography Data
Supervisor: Eduard Gröller
Duration: 1. January 2010 — 16. July 2021
[ HABILITATION THESIS]
Alexandra Diehl, Rodrigo Pelorosso, J Ruiz, Renato Pajarola, Eduard Gröller, Stefan Bruckner
Hornero: Thunderstorms Characterization using Visual Analytics
Computer Graphics Forum, 40(3):1-12, June 2021. [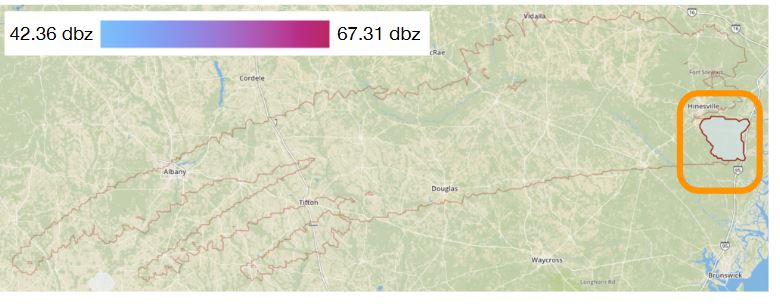 Image] [
 Paper]
Maath Musleh
Visual Analysis of Industrial Multivariate Time-Series Data: Effective Solution to Maximise Insights from Blow Moulding Machine Sensory Data
Jasmin Mahler
A Study of Multi-Document Active Reading in Analog and Digital Environments
[ poster] [
 thesis]
Thomas Köppel, Eduard Gröller, Hsiang-Yun Wu
Context-Responsive Labeling in Augmented Reality
In Proceedings of the 14th IEEE Pacific Visualization Symposium , pages 1-10. April 2021.
[![]() paper] [
paper] [ video]
Thorsten Korpitsch
LSOVOMAN - Large-Scale Online Visualization of Austria's Media- Advertisement Networks
Manuel Eiweck
Immersive Exploration of Hierarchical Networks in VR
[ thesis] [video & tool]
Sebastian Pirch, Felix Müller, Eugenia Iofinova, Julia Pazmandi, Christiane Hütter, Martin Chiettini, Celine Sin, Kaan Boztug, Iana Podkosova, Hannes Kaufmann, Jörg Menche
The VRNetzer platform enables interactive network analysis in Virtual Reality
Nature Communications, 12(2432):1-14, April 2021.
Katarína Furmanová, Ludvig Paul Muren, Oscar Casares-Magaz, Vitali Moiseenko, John P. Einck, Sara Pilskog, Renata Raidou
PREVIS: Predictive visual analytics of anatomical variability for radiotherapy decision support
Computers and Graphics, 97:126-138, April 2021. [ paper]
Tobias Batik
Embedding User-Defined Shapes into Metro Map Layouts
[ thesis]
Manuela Waldner, Thomas Geymayer, Dieter Schmalstieg, Michael Sedlmair
Linking unstructured evidence to structured observations
Information Visualization, January 2021. [ Paper] [
 preprint]
Payam Chini Foroushan
Visual Analytics for the Exploration of Cultural Models
Sherif Sakr, Angela Bonifati, Hannes Voigt, Alexandru Iosup, Hsiang-Yun Wu et al.
The Future is Big Graphs! A Community View on Graph Processing Systems
Communications of the ACM , x:1-14, December 2020. [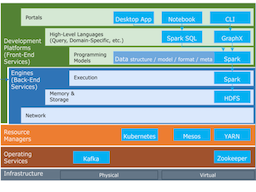 image] [
 paper]
Marko Spegel-Grünberger
Charakterisierung der Population von Pflegepatienten in zwei Pflegespitälern mithilfe interaktiver Visualisierungen elektronischer Patientendaten
Alexander Gall
Immersive Analytics of Multidimensional Volumetric Data
[ Image] [
 Master Thesis] [
 Poster]
Hsiang-Yun Wu, Martin Nöllenburg, Ivan Viola
Multi-level Area Balancing of Clustered Graphs
IEEE Transactions on Visualization and Computer Graphics (TVCG), x:1-15, November 2020. [ paper] [
 video]
Eduard Gröller
Interactive Visual Data Analysis,
9. November 2020, KAUST, Saudi Arabia
Simon Pointner
Controllable Animation for Information Visualisation
Katarína Furmanová, Nicolas Grossmann, Ludvig Paul Muren, Oscar Casares-Magaz, Vitali Moiseenko, John P. Einck, Eduard Gröller, Renata Raidou
VAPOR: Visual Analytics for the Exploration of Pelvic Organ Variability in Radiotherapy
Computer & Graphics, 91:25-38, October 2020.
Ladislav Čmolík, Václav Pavlovec, Hsiang-Yun Wu, Martin Nöllenburg
Mixed Labeling: Integrating Internal and External Labels
IEEE Transactions on Visualization and Computer Graphics (TVCG), x:1-14, September 2020. [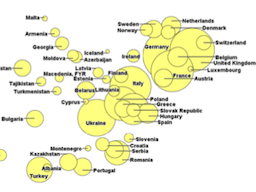 image] [
 paper]
Eduard Gröller
Interactive Visual Data Analysis,
19. September 2020, Bejing
Akari Iijima, Takayuki Itoh, Hsiang-Yun Wu, Nicolas Grossmann
Visualization of Semantic Differential Studies with a Large Number of Images, Participants and Attributes
In Proceedings of the 24th International Conference on Information Visualisation (iV2020), pages 1-6. September 2020.
[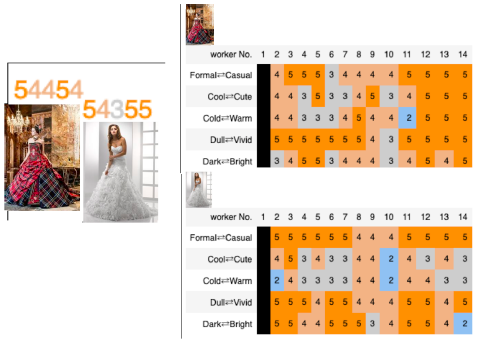 image] [
 paper]
Narumi Kuroko, Hayato Ohya, Takayuki Itoh, Nicolas Grossmann, Hsiang-Yun Wu
Visualization of Correlations between Places of Music Listening and Acoustic Features
In Proceedings of the 24th International Conference on Information Visualisation (iV2020), pages 1-6. September 2020.
[ image] [
 paper]
Helen C. Purchase, Daniel Archambault, Stephen Kobourov, Martin Nöllenburg, Sergey Pupyrev, Hsiang-Yun Wu
The Turing Test for Graph Drawing Algorithms
In Proceedings of the 28th International Symposium on Graph Drawing and Network Visualization (GD2020), pages 1-16. September 2020.
[ image] [
 paper]
Christoph Presch
Semi-Automatic Creation of Concept Maps
[ Master Thesis] [
 Poster] [
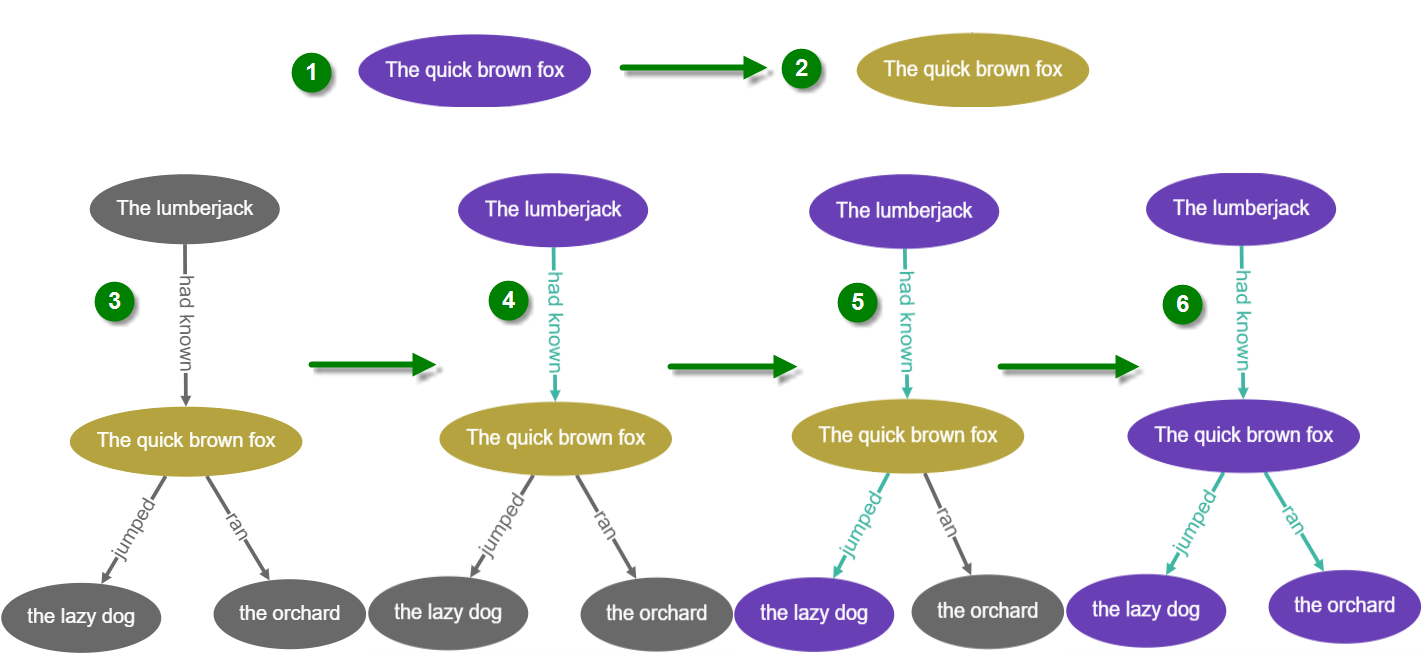 teaser]
Theresa Neubauer
Volumetric Image Segmentation on Multimodal Medical Images using Deep Learning
[ image] [
 Master Thesis] [
 Poster]
Oliver Pilizar
Artistic Metro Maps
Zoltan Oremus, Kahin Akram Hassan, Jiri Chmelik, Michaela Knazkova, Jan Byska, Renata Raidou, Barbora Kozlikova
PINGU Principles of Interactive Navigation for Geospatial Understanding
In 2020 IEEE Pacific Visualization Symposium (PacificVis), pages 216-225. June 2020.
Hsiang-Yun Wu, Benjamin Niedermann, Shigeo Takahashi, Maxwell J. Roberts, Martin Nöllenburg
A Survey on Transit Map Layout – from Design, Machine, and Human Perspectives
Computer Graphics Forum, 39(3):619-646, May 2020. [ image] [
 paper]
Eduard Gröller
Visual Analytics in Radiation Therapy Planning,
15. May 2020, Bergen, Norway
Renata Raidou, Katarína Furmanová, Nicolas Grossmann, Oscar Casares-Magaz, Vitali Moiseenko, John P. Einck, Eduard Gröller, Ludvig Paul Muren
Lessons Learnt from Developing Visual Analytics Applications for Adaptive Prostate Cancer Radiotherapy
In The Gap between Visualization Research and Visualization Software (VisGap) (2020), pages 1-8. May 2020.
Wolfgang Gundacker
Wilangyman - Eine Google-Chrome Erweiterung die Wikipedia-Artikel um fremdsprachliche Inhalte ergänzt
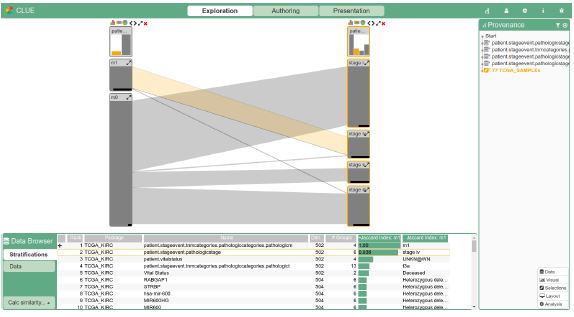
Manuela Waldner, Daniel Steinböck, Eduard Gröller
Interactive exploration of large time-dependent bipartite graphs
Journal of Computer Languages, 57, April 2020. [paper]
Daniel Cornel
Interactive Visualization of Simulation Data for GeospatialDecision Support
Supervisor: Eduard Gröller
[ image] [
 PhD Thesis]
Anja Heim, Alexander Gall
DDE - Dynamic Data Explorer: Dynamic data exploration in a collaborative spatial-aware environment
Johannes Sorger, Manuela Waldner, Wolfgang Knecht, Alessio Arleo
Immersive Analytics of Large Dynamic Networks via Overview and Detail Navigation
In 2nd International Conference on Artificial Intelligence & Virtual Reality, pages 144-151. December 2019.
[ video] [arxiv preprint]
Hsiang-Yun Wu, Martin Nöllenburg, Ivan Viola
Graph Models for Biological Pathway Visualization: State of the Art and Future Challenges,
20. October 2019, Vis 2019 Workshop, Canada
[ paper]
Michael Mazurek
Visual Active Learning for News Stream Classification
[ image] [
 Master thesis] [
 Poster]
Alessio Arleo, Christos Tsigkanos, Chao Jia, Roger Leite, Ilir Murturi, Manfred Klaffenböck, Schahram Dustdar, Silvia Miksch, Michael Wimmer, Johannes Sorger
Sabrina: Modeling and Visualization of Economy Data with Incremental Domain Knowledge
In IEEE VIS 2019. October 2019.
Stefan Sietzen, Manuela Waldner
Interactive Feature Visualization in the Browser
In Proceedings of the Workshop on Visualization for AI explainability (VISxAI). October 2019.
[ video] [Explainable URL]
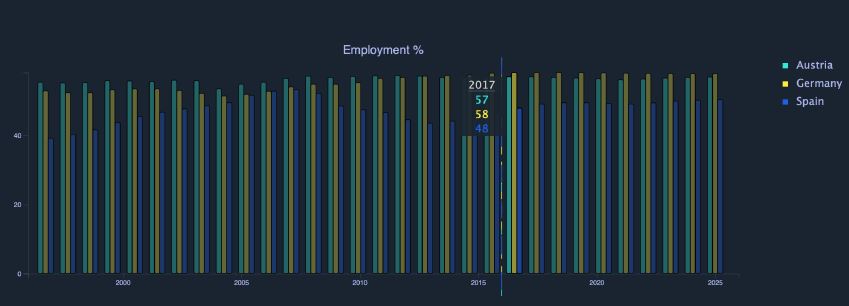
Manuela Waldner, Alexandra Diehl, Denis Gracanin, Rainer Splechtna, Claudio Delrieux, Kresimir Matkovic
A Comparison of Radial and Linear Charts for Visualizing Daily Patterns
IEEE Transactions on Visualization and Computer Graphics, 26:1033-1042, October 2019. [ paper]
Guangping Li, Soeren Nickel, Martin Nöllenburg, Ivan Viola, Hsiang-Yun Wu
World map of recipes
[ poster]
Hsiang-Yun Wu, Martin Nöllenburg, Ivan Viola
Map of Metabolic Harmony
[ image-full]
Nicolas Grossmann, Oscar Casares-Magaz, Ludvig Paul Muren, Vitali Moiseenko, John P. Einck, Eduard Gröller, Renata Raidou
Pelvis Runner: Visualizing Pelvic Organ Variability in a Cohort of Radiotherapy Patients
In Eurographics Workshop on Visual Computing for Biology and Medicine (2019), pages 69-78. September 2019.
Georg Bernold, Kresimir Matkovic, Eduard Gröller, Renata Raidou
preha: Establishing Precision Rehabilitation with Visual Analytics
In Eurographics Workshop on Visual Computing for Biology and Medicine (2019), pages 79-89. September 2019.
Stefan Sietzen
Web-Interface for neural network feature visualization
[VISxAI URL]
Renata Raidou
Visual Analytics for the Representation, Exploration and Analysis of High-Dimensional, Multi-Faceted Medical Data
In Biomedical Visualisation, pages 137-162, July 2019
Kazuyo Mizuno, Hsiang-Yun Wu, Shigeo Takahashi, Takeo Igarashi
Optimizing Stepwise Animation in Dynamic Set Diagrams
Computer Graphics Forum, 38:13-24, July 2019. [ paper] [video]
Ken Maruyama, Shigeo Takahashi, Hsiang-Yun Wu, Kazuo Misue, Masatoshi Arikawa
Scale-Aware Cartographic Displacement Based on Constrained Optimization
In Proceedings of the 23th International Conference on Information Visualisation (iV2019), pages 74-80. July 2019.
Jan Byska, Thomas Trautner, Sergio Marques, Jiri Damborsky, Barbora Kozlikova, Manuela Waldner
Analysis of Long Molecular Dynamics Simulations Using Interactive Focus+Context Visualization
Computer Graphics Forum, 38(3):441-453, June 2019. [ paper] [
 video]
Shigeo Takahashi, Ken Maruyama, Takamasa Kawagoe, Hsiang-Yun Wu, Kazuo Misue, Masatoshi Arikawa
Mental Map Preservation for Progressively Labeling Railway Networks
International Journal of Art, Culture and Design Technologies, 8(1):31-50, June 2019. [ pdf]
pdf]
Troidl Jakob
Flow Visualization on Curved Manifolds
[ Bachelor Thesis] [
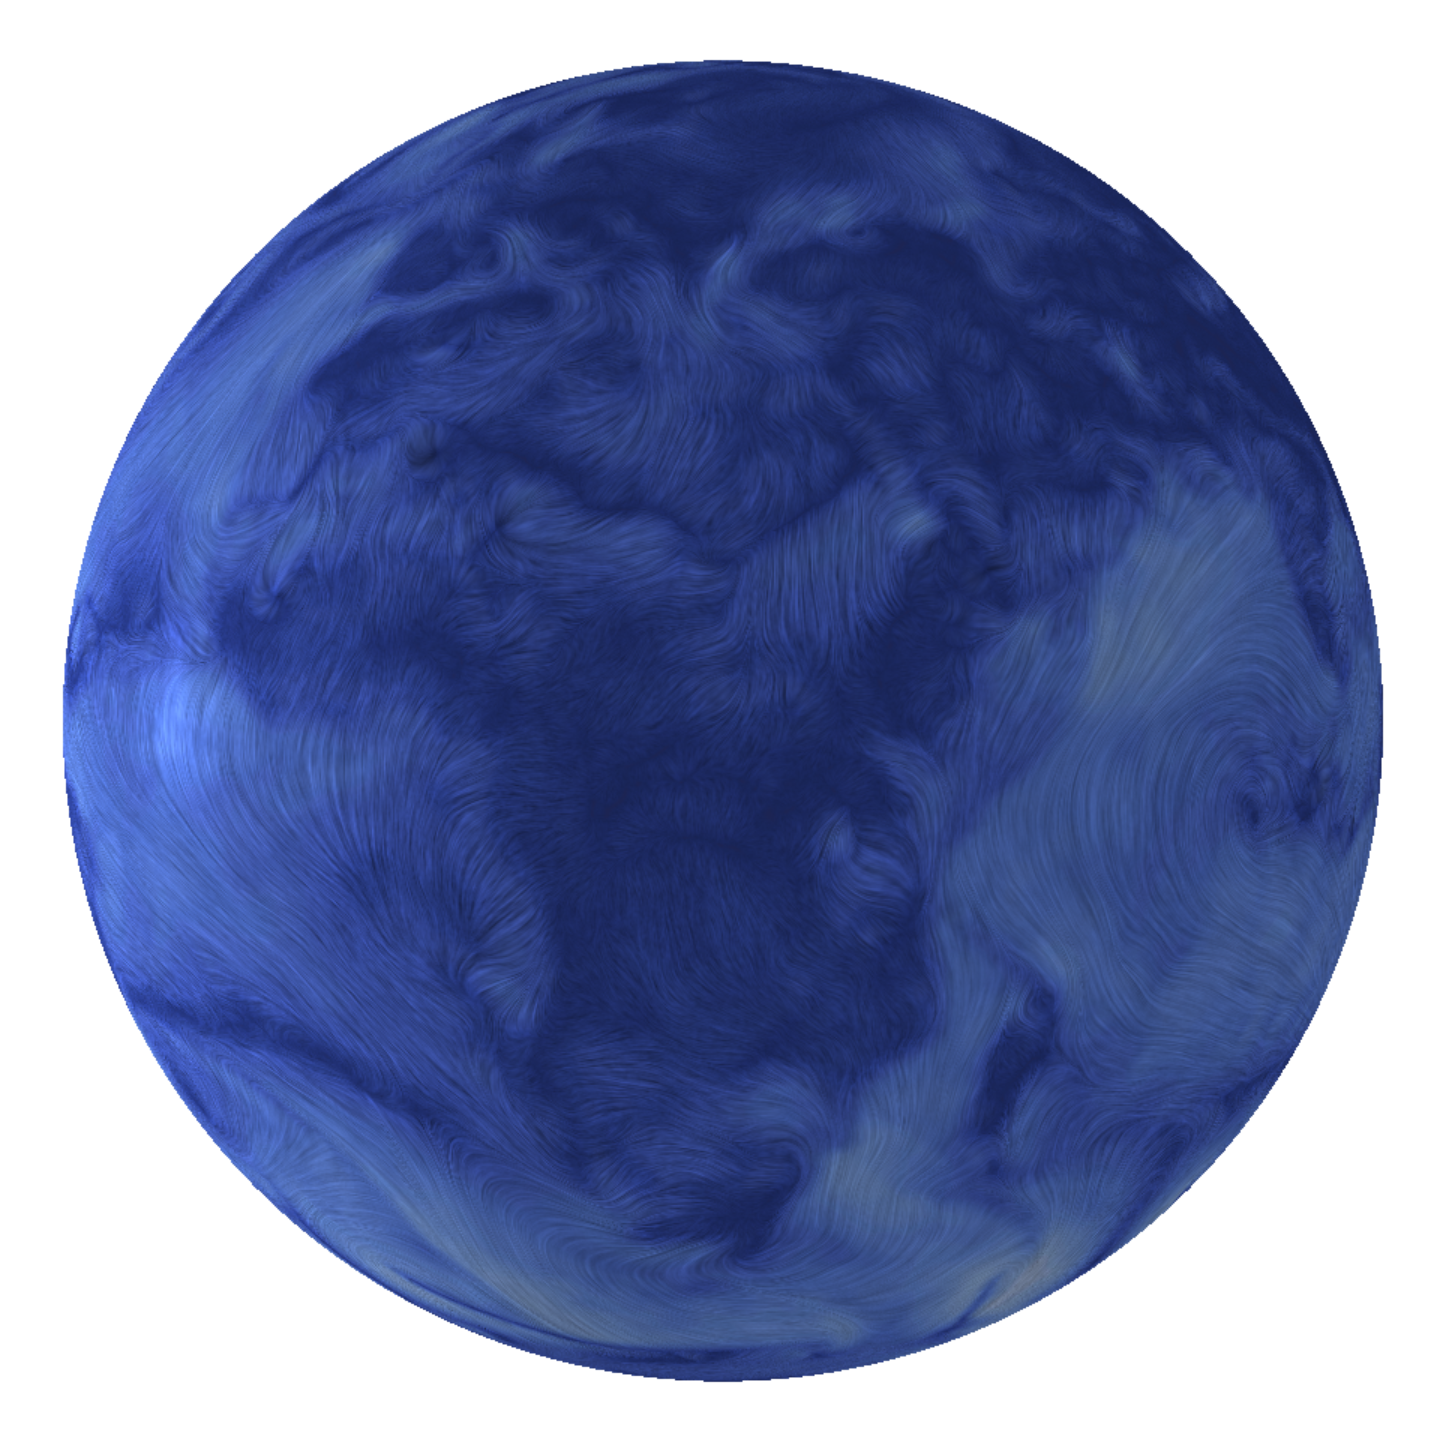 image] [Youtube: Flow Visualization on Curved Manifolds]
Hsiang-Yun Wu, Martin Nöllenburg, Filipa L. Sousa, Ivan Viola
Metabopolis: Scalable Network Layout for Biological Pathway Diagrams in Urban Map Style
BMC Bioinformatics, 20(187):1-20, May 2019. [ paper] [video]
Gwendolyn Rippberger
Data-Driven Anatomical Layouting of Brain Network Graphs
[ Bachelor Thesis] [
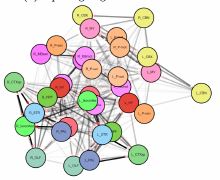 image]
Elitza Vasileva, Hsiang-Yun Wu
OptiRoute: Interactive Maps for Wayfinding in a Complex Environment
Poster shown at schematic Mapping Workshop 2019
(2019)
Hsiang-Yun Wu, Benjamin Niedermann, Shigeo Takahashi, Martin Nöllenburg
A Survey on Computing Schematic Network Maps: The Challenge to Interactivity,
11. April 2019, The 2nd Schematic Mapping Workshop 2019, Vienna, Austria
[ paper]
Hsiang-Yun Wu, Ken Maruyama, Takamasa Kawagoe, Kazuo Misue, Masatoshi Arikawa, Shigeo Takahashi
Aspect-Ratio-Preserved Labeling on Metro Maps
Poster shown at Schematic Mapping Workshop 2019
(2019)
Muhammad Samoul
Visual Comparison of NLP Pipelines
Hsiang-Yun Wu, Haichao Miao, Ivan Viola
From Cells to Atoms - Biological Information Visualization (in Chinese)
TR-193-02-2019-1, March 2019 [ paper]
Renata Raidou, Eduard Gröller, Martin Eisemann
Relaxing Dense Scatter Plots with Pixel-Based Mappings
IEEE Transactions on Visualization and Computer Graphics, 25:1-12, March 2019.
Nicholas Waldin, Manuela Waldner, Mathieu Le Muzic, Eduard Gröller, David Goodsell, Ludovic Autin, Arthur Olson, Ivan Viola
Cuttlefish: Color Mapping for Dynamic Multi‐Scale Visualizations
Computer Graphics Forum, 38(6):150-164, March 2019. [Open Access Article in Wiley Online Library]
Harald Steinlechner, Georg Haaser, Bernd Oberdorfer, Daniel Habe, Stefan Maierhofer, Michael Schwärzler, Eduard Gröller
A Novel Approach for Immediate, Interactive CT Data Visualization andEvaluation using GPU-based Segmentation and Visual Analysis
In International Conference on Industrial Computed Tomography (ICT) 2019, pages 1-6. February 2019.
[ draft]
Katharina Unger
Visual Comparison of Organism-Specific Metabolic Pathways
[ CESCG paper]
Vahan Yoghourdjian, Daniel Archambault, Stephan Diehl, Tim Dwyer, Karsten Klein, Helen C. Purchase, Hsiang-Yun Wu
Exploring the limits of complexity: A survey of empirical studies ongraph visualisation
Visual Informatics, 2(4):264-282, January 2019. [ paper]
Patrick Hromniak
Visual Comparison of Natural Language Processing Pipelines
Daniel Archambault, Jessie Kennedy, Tatiana von Landesberger, Mark McCann, Fintan McGee, Benjamin Renoust, Hsiang-Yun Wu
Lost in Translation: Alignment of Mental Representations for Visual Analytics, Reimagining the Mental Map and Drawing Stability (NII Shonan Meeting Seminar 127)
TR-193-02-2018-1, December 2018 [ paper]
Elitza Vasileva
Interactive Maps for Visualizing Optimal Route Planning Strategy
[ image]
Maximilian Deutsch
Generating seating plan images using clustering and concave hull algorithms
Georg Edlinger
Visually Linking web search results with bookmarked information
Daniel Steinböck, Eduard Gröller, Manuela Waldner
Casual Visual Exploration of Large Bipartite Graphs Using Hierarchical Aggregation and Filtering
In International Symposium on Big Data Visual and Immersive Analytics. October 2018.
[ paper]
Manfred Klaffenböck
(untitled)
Supervisor: Michael Wimmer
Duration: September 2018 —
Thomas Mühlbacher
Human-Oriented Statistical Modeling: Making Algorithms Accessible through Interactive Visualization
Supervisor: Eduard Gröller
Duration: June 2012 — August 2018
[ image]
Klaus Eckelt
Data-Driven User Guidance in Multi-Attribute Data Exploration
[ image] [
 Poster]
Yuka Yoshida, Ken Maruyama, Takamasa Kawagoe, Hsiang-Yun Wu, Masatoshi Arikawa, Shigeo Takahashi
Progressive Annotation of Schematic Railway Maps
In Proceedings of the 22nd International Conference Information Visualisation (IV). July 2018.
Michael Mazurek, Manuela Waldner
Visualizing Expanded Query Results
Computer Graphics Forum:87-98, June 2018. [ paper] [
 video]
Haichao Miao, Elisa De Llano, Tobias Isenberg, Eduard Gröller, Ivan Barisic, Ivan Viola
DimSUM: Dimension and Scale Unifying Maps for Visual Abstraction of DNA Origami Structures
Computer Graphics Forum, 37(3), June 2018. [ Paper]
Hsiang-Yun Wu, Martin Nöllenburg, Ivan Viola
A Visual Comparison of Hand-Drawn and Machine-Generated Human Metabolic Pathways
Poster shown at EuroVis
( 4. June 2018- 8. June 2018)
[ poster]
Daniel Steinböck
Interactive Visual Exploration Interface for Large Bipartite Networks
[ Master Thesis] [
 Poster] [
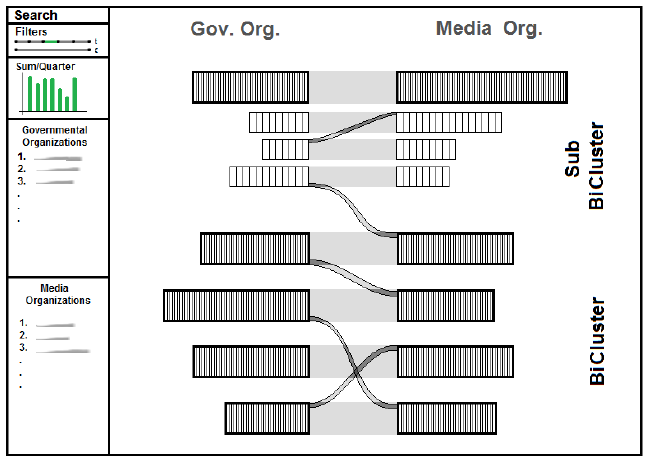 sketch]
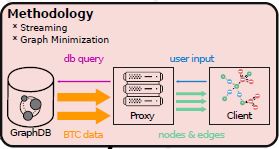
Matthias Gusenbauer
Bitstream - A bottom-up/top-down hybrid approach for web-based visual analysis of big data
[ image] [
 Master thesis]
Matthias Gusenbauer
Bitstream - Top-Down/Bottom-Up Data Processing for Interactive Bitcoin Visualization.
Poster shown at EPILOG
(18. June 2018)
[ image]
Michael Birsak, Przemyslaw Musialski, Peter Wonka, Michael Wimmer
Dynamic Path Exploration on Mobile Devices
IEEE Transactions on Visualization and Computer Graphics, 24(5):1784-1798, May 2018. [ preprint]
Yan Cai
Research on Graphical Interfaces to Perform Anatomical Queries on Large Collections of Gene Expression Images
[ Bachelor Thesis] [
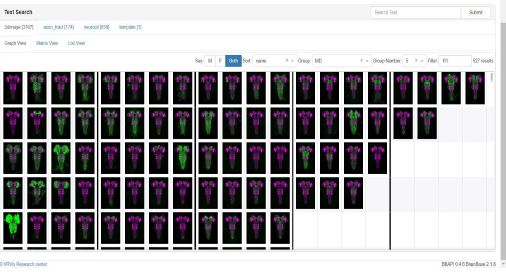 image]
Dea Cizmic
Exploratory Data Visualization Dashboard for Technical Analysis of Commodity Market Indicators
Martin Smiech
Configurable Text Exploration Interface with NLP for Decision Support
Hsiang-Yun Wu, Martin Nöllenburg, Ivan Viola
The Travel of a Metabolite
submitted to PacificVis 2018 Data Story Telling Contest
[ paper] [
 video]
Patrik Polatsek, Manuela Waldner, Ivan Viola, Peter Kapec, Wanda Benesova
Exploring visual attention and saliency modeling for task-based visual analysis
Computers & Graphics, (2), February 2018. [ paper]
Hsiang-Yun Wu, Shigeo Takahashi, Rie Ishida
Overlap-Free Labeling of Clustered Networks Based on Voronoi Tessellation
Journal of Visual Languages & Computing, (44), February 2018. [ paper]
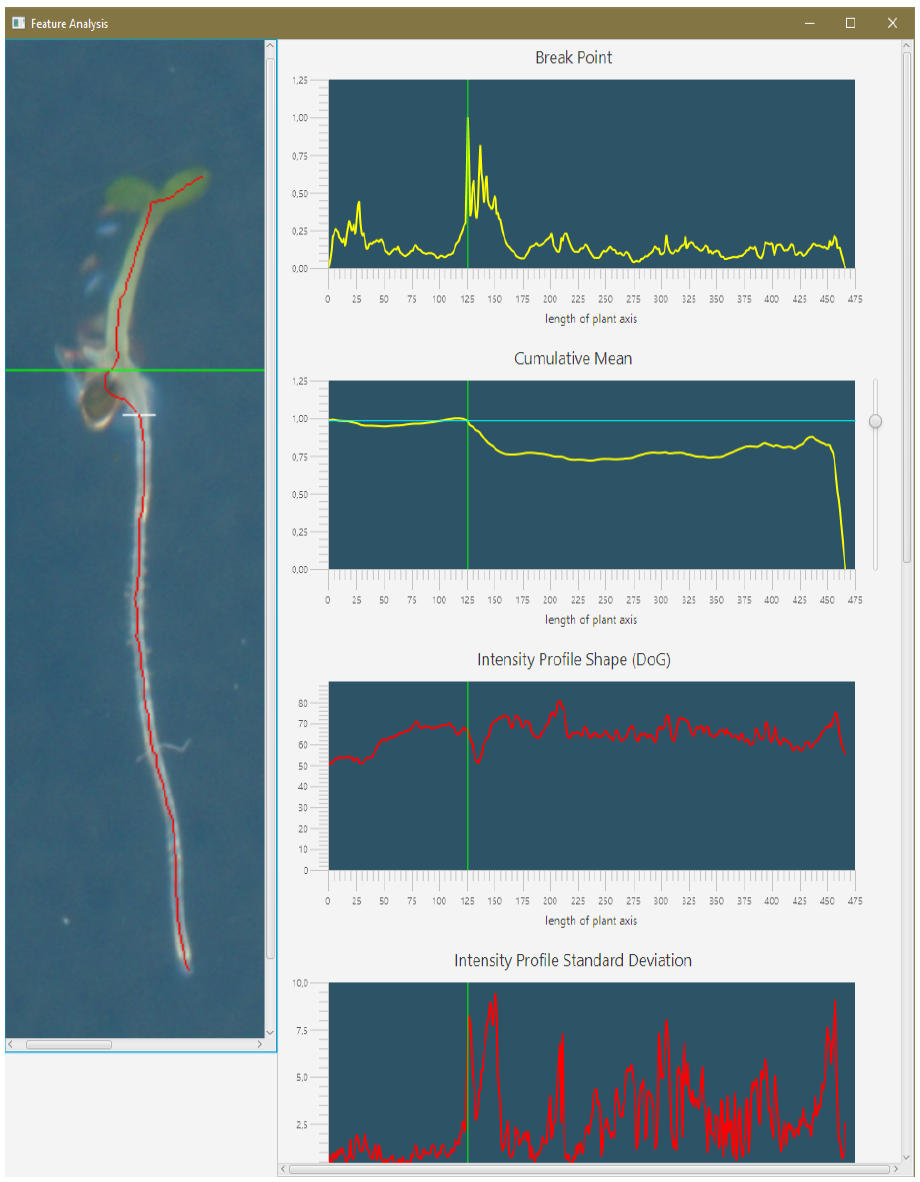
Julian Strohmayer
A Visual Analytics Approach to Hypocotyl/Root Transition Detection in Arabidopsis Thaliana
[ image]
Renata Raidou
EuroVis Best PhD Award 2018—Visual Analytics for Digital Radiotherapy: Towards a Comprehensible Pipeline
Radu Jianu, Martin Krzywinski, Luana Micallef, Hsiang-Yun Wu
Mapifying the Genome, Scalable Set Visualizations (Dagstuhl Seminar 17332)
TR-193-02-2018-2, 2018 [ paper]
Werner Purgathofer
From Visualization to Decision Support,
29. September 2017, Hangzhou, China
Werner Purgathofer
From Visualization to Decision Support,
28. September 2017, Nanjing, China
Johannes Sorger
Integration Strategies in the Visualization of Multifaceted Spatial Data
Supervisor: Ivan Viola
Duration: 2013 — 2017
[ thesis]
Werner Purgathofer
Visual Computing als Interface zur Entscheidungsunterstützung,
4. July 2017, Wien
Guillermo Garcia-Escribano
Visual Evaluation of Computational Models of the Biological Mesoscale
Thomas Geymayer, Manuela Waldner, Alexander Lex, Dieter Schmalstieg
How Sensemaking Tools Influence Display Space Usage
In EuroVis Workshop on Visual Analytics. June 2017.
[ paper]
Manuela Waldner, Alexey Karimov, Eduard Gröller
Exploring Visual Prominence of Multi-Channel Highlighting in Visualizations
In Spring Conference on Computer Graphics 2017. May 2017.
[ paper]
Julian Wagner
3D-Printing of Fetal Ultrasound
[ Bachelor Thesis] [
 image]
Michael Mazurek
Stream I/O - An Interactive Visualization of Publication Data
Michael Mazurek
Visualization of Thesaurus-Based Web Search
Daniel Steinböck
Visualization of EU Funding Programmes
Viktor Vad, Jan Byska, Adam Jurcik, Ivan Viola, Eduard Gröller, Helwig Hauser, Sergio M. Margues, Jiri Damborsky, Barbora Kozlikova
Watergate: Visual Exploration of Water Trajectories in Protein Dynamics
In Eurographics Workshop on Visual Computing for Biology and Medicine 2017, pages 33-42. 2017.
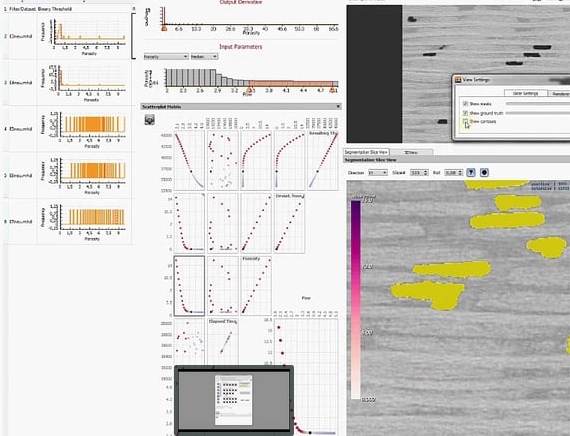
Johannes Weissenböck, Artem Amirkhanov, Eduard Gröller, Johannes Kastner, Christoph Heinzl
PorosityAnalyzer: Visual Analysis and Evaluation of Segmentation Pipelines to Determine the Porosity in Fiber-Reinforced Polymers
In IEEE Conference on Visual Analytics Science and Technology, 2016 (VAST 2016), pages 101-110. October 2016.
[ image]
Renata Raidou, Freek Marcelis, Marcel Breeuwer, Eduard Gröller, Anna Vilanova i Bartroli, Huub van de Wetering
Visual Analytics for the Exploration and Assessment of Segmentation Errors
Eurographics Workshop on Visual Computing for Biology and Medicine:193-202, September 2016. [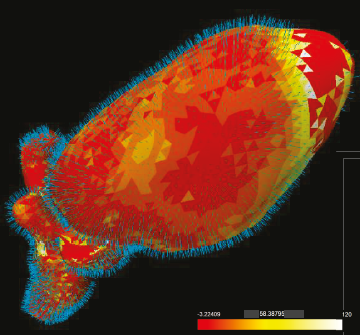 image] [
 Paper]
Lucas Dworschak
Semantically Zoomable Choropleth Map
Johanna Schmidt
Scalable Comparative Visualization
Supervisor: Eduard Gröller
Duration: 2011 — 2016
Hani Gadllah
Comparative Visualization of the Circle of Willis
[ image]
Thomas Ortner, Johannes Sorger, Harald Piringer, Gerd Hesina, Eduard Gröller
Visual analytics and rendering for tunnel crack analysis
The Visual Computer, 32(6):859-869, May 2016.
Johanna Schmidt, Bernhard Fröhler, Reinhold Preiner, Johannes Kehrer, Eduard Gröller, Stefan Bruckner, Christoph Heinzl
Visual Analysis of Volume Ensembles Based on Local Features
TR-186-2-16-2, May 2016
Tobias Klein, Stefan Bruckner, Eduard Gröller, Markus Hadwiger, Peter Rautek
Towards Interactive Visual Exploration of Parallel Programs using a Domain-Specific Language
Poster shown at 4th International Workshop on OpenCL (IWOCL '16)
()
Thomas Ortner, Johannes Sorger, Harald Steinlechner, Gerd Hesina, Harald Piringer, Eduard Gröller
Vis-a-ware: Integrating spatial and non-spatial visualization for visibility-aware urban planning
Visualization and Computer Graphics, IEEE Transactions on, January 2016.
Johannes Sorger, Thomas Ortner, Christian Luksch, Michael Schwärzler, Eduard Gröller, Harald Piringer
LiteVis: Integrated Visualization for Simulation-Based Decision Support in Lighting Design
Visualization and Computer Graphics, IEEE Transactions on, 22(1):290-299, January 2016. [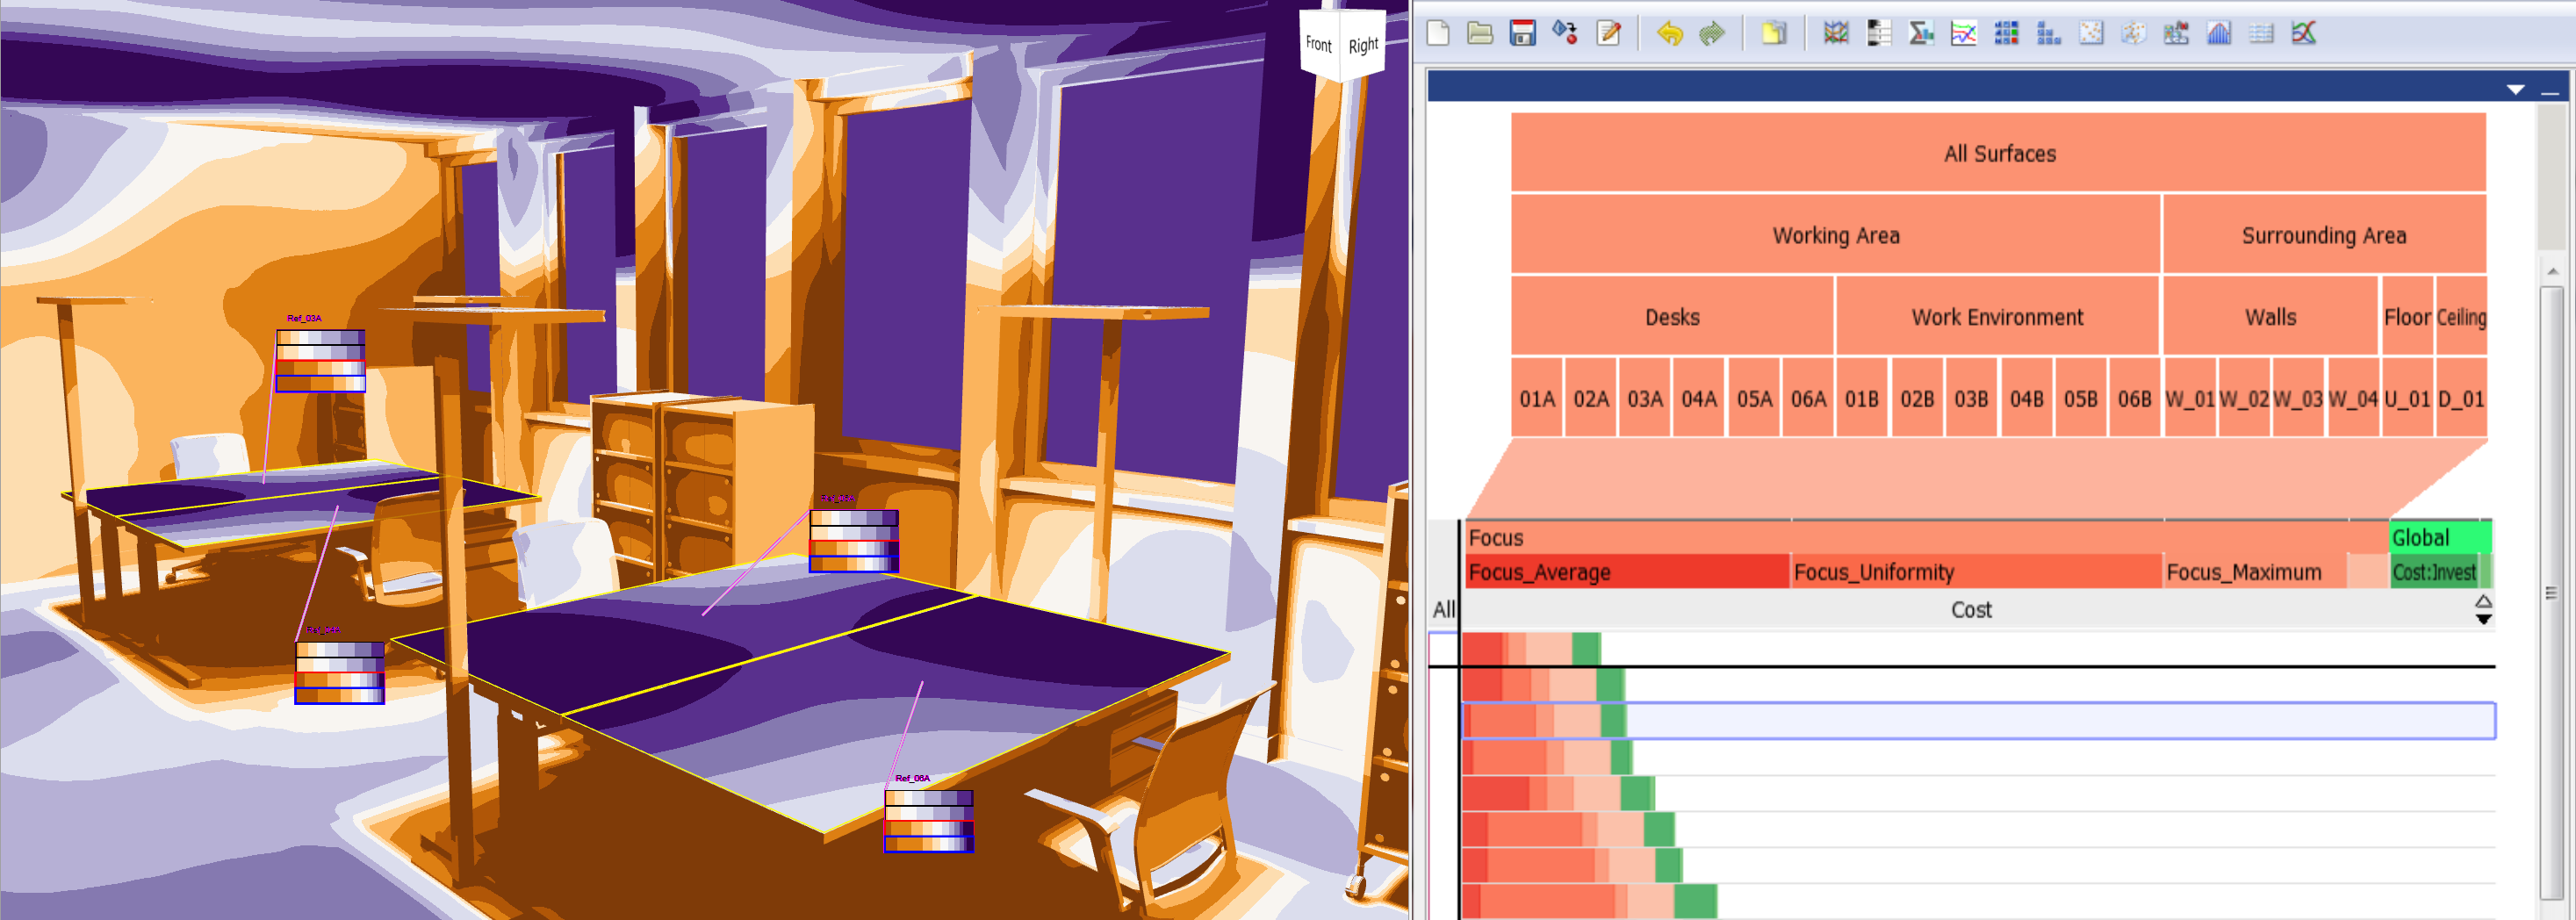 teaser]
Min Chen, Miquel Feixas, Ivan Viola, Anton Bardera, Mateu Sbert, Han Wei Shen
Information Theory Tools for Visualization. CRC Press, 2016.
Aleksandr Amirkhanov, Artem Amirkhanov, Dietmar Salaberger, Johannes Kastner, Eduard Gröller, Christoph Heinzl
Visual Analysis of Defects in Glass Fiber Reinforced Polymers for 4DCT Interrupted In situ Tests
Computer Graphics Forum (2016), 35(3):201-210, 2016. [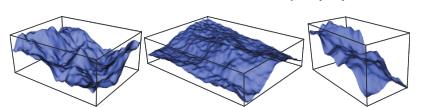 image] [
 Paper]
Sanjin Rados, Rainer Splechtna, Kresimir Matkovic, Mario Duras, Eduard Gröller, Helwig Hauser
Towards Quantitative Visual Analytics with Structured Brushing and Linked Statistics
Computer Graphics Forum (2016), 35(3):251-260, 2016. [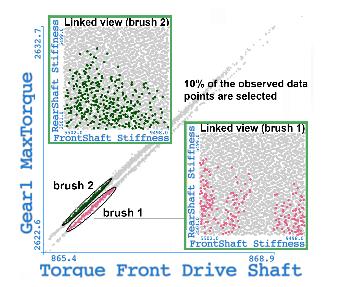 image] [
 paper]
Haichao Miao, Gabriel Mistelbauer, Christian Nasel, Eduard Gröller
Visual Quantification of the Circle of Willis: An Automated Identification and Standardized Representation
Computer Graphics Forum, 2016.
Renata Raidou, Oscar Casares-Magaz, Ludvig Paul Muren, Uulke A van der Heide, Jarle Roervik, Marcel Breeuwer, Anna Vilanova i Bartroli
Visual Analysis of Tumor Control Models for Prediction of Radiotherapy Response.
EuroVis - Eurographics/IEEE-VGTC Symposium on Visualization 2016, 2016.
Renata Raidou, Hugo J. Kuijf, Neda Sepasian, Nicola Pezzotti, Willem H. Bouvy, Marcel Breeuwer, Anna Vilanova i Bartroli
Employing Visual Analytics to Aid the Design of White Matter Hyperintensity Classifiers.
Proceedings of International Conference on Medical Image Computing and Computer Assisted Intervention (MICCAI), 2016.
Alexandra Diehl, Leandro Pelorosso, Kresimir Matkovic, Claudio Delrieux, Marc Ruiz, Eduard Gröller, Stefan Bruckner
Albero: A Visual Analytics Tool for Probabilistic Weather Forecasting.
Poster shown at Poster at Workshop Big Data & Environment
(November 2015)
Tobias Klein
Towards Interactive Visual Exploration of Parallel Programs using a Domain-specific Language
[ Poster] [
 Thesis]
María Luján Ganuza, Maria Florencia Gargiulo, Gabriela Ferracutti, Silvia Castro, Ernesto Bjerg, Eduard Gröller, Kresimir Matkovic
Interactive Semi-Automatic Categorization for Spinel Group Minerals
Poster shown at 2015 IEEE Conference on Visual Analytics Science and Technology (VAST) (2015)
(25. October 2015-30. October 2015)
Johannes Sorger, Thomas Ortner, Harald Piringer, Gerd Hesina, Eduard Gröller
A Taxonomy of Integration Techniques for Spatial and Non-Spatial Visualizations
In 20th International Symposium on Vision, Modeling and Visualization (VMV 2015). October 2015.
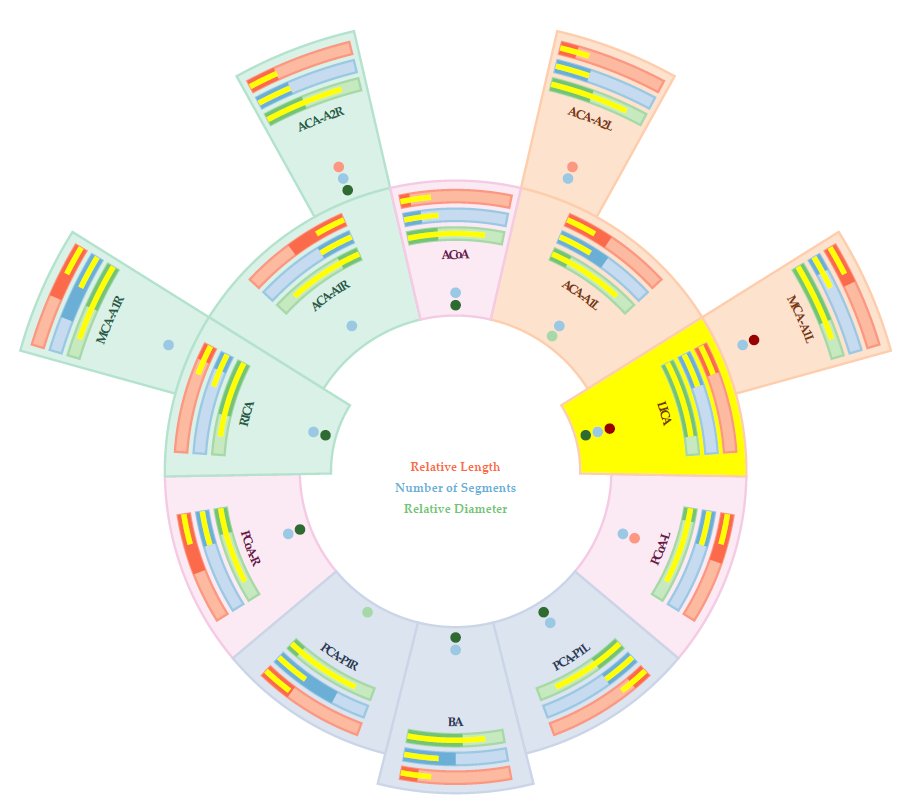
Haichao Miao, Gabriel Mistelbauer, Christian Nasel, Eduard Gröller
CoWRadar: Visual Quantification of the Circle of Willis in Stroke Patients
In EG Workshop on Visual Computing for Biology and Medicine, pages 1-10. September 2015.
[ demo] [
 paper]
Alexandra Diehl, Eduard Gröller, Stefan Bruckner
Visual Analysis of Spatio-Temporal Data: Applications in Weather Forecasting
In Computer Graphic Forum, pages 381-390. May 2015.
[ Paper]
Kresimir Matkovic
Interactive Visual Analysis of Multi-Parameter Scientific Data
Duration: 2005 — 2014
[ Habilitation Thesis]
Haichao Miao
Visual Quantification of the Circle of Willis in Stroke Patients
[ poster] [
 Thesis]
Renata Raidou, Uulke A van der Heide, Cuong V Dinh, Ghazaleh Ghobadi, Jesper Follsted Kallehauge, Marcel Breeuwer, Anna Vilanova i Bartroli
Visual analytics for the exploration of tumor tissue characterization
In Computer Graphics Forum, 2015.
Renata Raidou, Martin Eisemann, Marcel Breeuwer, Elmar Eisemann, Anna Vilanova i Bartroli
Orientation-Enhanced Parallel Coordinate Plots
IEEE transactions on visualization and computer graphics, 22(1):589-598, 2015.
Michael Beham, Wolfgang Herzner, Eduard Gröller, Johannes Kehrer
Cupid: Cluster-based Exploration of Geometry Generators with Parallel Coordinates and Radial Trees
IEEE Transactions on Visualization and Computer Graphics, 20(12):1693-1702 , December 2014.
Artem Konev, Jürgen Waser, Berhard Sadransky, Daniel Cornel, Rui A.P. Perdigao, Zsolt Horvath, Eduard Gröller
Run Watchers: Automatic Simulation-Based Decision Support in Flood Management
IEEE Transactions on Visualization and Computer Graphics, 20(12):1873-1882, December 2014. [ Paper]
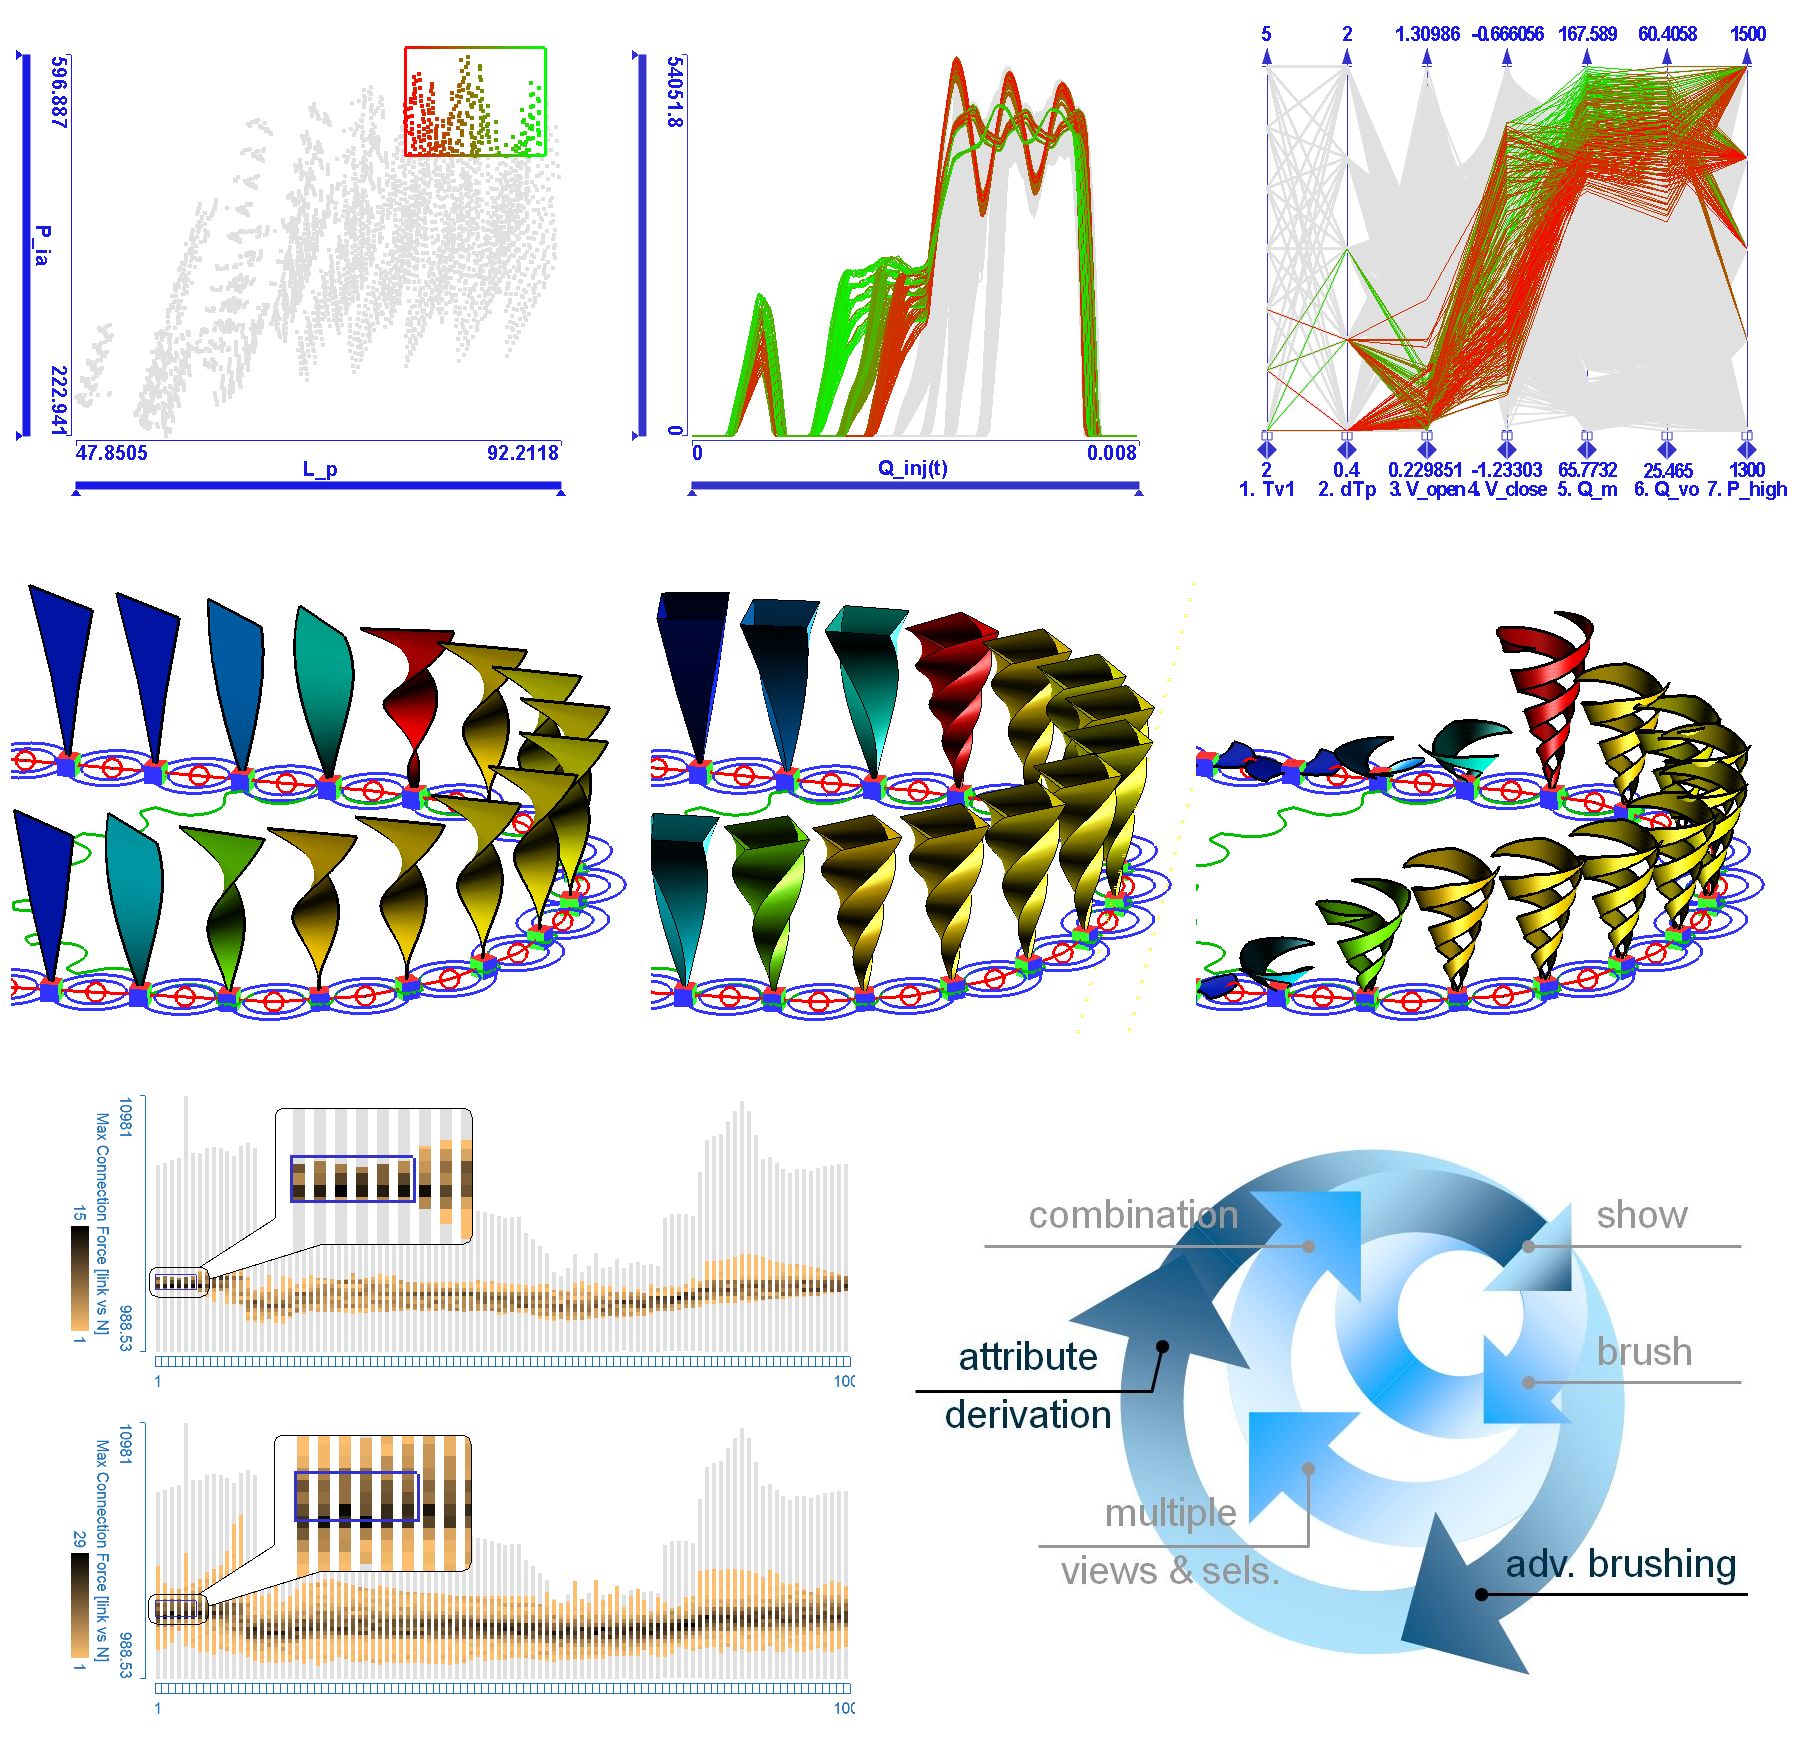
Kresimir Matkovic, Denis Gracanin, Rainer Splechtna, M. Jelovic, Benedikt Stehno, Helwig Hauser, Werner Purgathofer
Visual Analytics for Complex Engineering Systems: Hybrid Visual Steering of Simulation Ensembles
IEEE Transactions on Visualization and Computer Graphics, 20(12):1803-1812, December 2014.
Johanna Schmidt, Reinhold Preiner, Thomas Auzinger, Michael Wimmer, Eduard Gröller, Stefan Bruckner
YMCA - Your Mesh Comparison Application
In IEEE Visual Analytics Science and Technology. November 2014.
Manuela Waldner, Stefan Bruckner, Ivan Viola
Graphical Histories of Information Foraging
In Proceedings of the 8th Nordic Conference on Human-Computer Interaction: Fun, Fast, Foundational , pages 295-304. October 2014.
[ paper]
Michael Birsak, Przemyslaw Musialski, Peter Wonka, Michael Wimmer
Automatic Generation of Tourist Brochures
Computer Graphics Forum (Proceedings of EUROGRAPHICS 2014), 33(2):449-458, April 2014. [ preprint] [
 video]
Renata Raidou, Uulke A van der Heide, PJ van Houdt, Marcel Breeuwer, Anna Vilanova i Bartroli
The iCoCooN:Integration of Cobweb Charts with Parallel Coordinates forVisual Analysis of DCE-MRI Modeling Variations
Eurographics Workshop on Visual Computing for Biology and Medicine , 2014.
Renata Raidou, Marta Paes Moreira, Wouter van Elmpt, Marcel Breeuwer, Anna Vilanova i Bartroli
Visual analytics for the exploration of multiparametric cancer imaging
In Visual Analytics Science and Technology (VAST), 2014 IEEE Conference on Visualization, 2014.
Johannes Kehrer, Harald Piringer, Wolfgang Berger, Eduard Gröller
A Model for Structure-based Comparison of Many Categories in Small-Multiple Displays
IEEE Transactions on Visualization and Computer Graphics, 19(12):2287-2296, December 2013. [ Draft] [
 Slides]
Johanna Schmidt, Eduard Gröller, Stefan Bruckner
VAICo: Visual Analysis for Image Comparison
IEEE Transactions on Visualization and Computer Graphics, 19(12):2090-2099, December 2013.
Johannes Sorger, Katja Bühler, Florian Schulze, Tianxiao Liu, Barry Dickson
neuroMAP - Interactive Graph-Visualization of the Fruit Fly's Neural Circuit
In Biological Data Visualization (BioVis), 2013 IEEE Symposium on , pages 73-80. October 2013.
Rita Borgo, Johannes Kehrer, David H.S. Chung, Eamonn Maguire, Robert S. Laramee, Helwig Hauser, Matthew Ward, Min Chen
Glyph-based Visualization: Foundations, Design Guidelines, Techniques and Applications
Eurographics State of the Art Reports:39-63, May 2013.
Manuela Waldner, Johann Schrammel, Michael Klein, Katrin Kristjansdottir, Dominik Unger, Manfred Tscheligi
FacetClouds: Exploring Tag Clouds for Multi-Dimensional Data
In Proceedings of the 2013 Graphics Interface Conference, pages 17-24. May 2013.
[ paper]
Manuela Waldner, Dieter Schmalstieg
Towards Ubiquitous Information Space Management
In POWERWALL: International Workshop on Interactive, Ultra-High-Resolution Displays, part of the SIGCHI Conference on Human Factors in Computing Systems (2013), pages 1-6. May 2013.
[ Position Paper]
Johannes Kehrer, Helwig Hauser
Visualization and Visual Analysis of Multi-faceted Scientific Data: A Survey
IEEE Transactions on Visualization and Computer Graphics, 19(3):495-513, March 2013. [ Draft] [
 Slides]
Zoltan Konyha
Interactive Visual Analysis in Automotive Engineering Design
Supervisor: Eduard Gröller
Duration: 2006 — 2013
[ Image] [
 Thesis]
Johannes Sorger
neuroMap - Interactive Graph-Visualization of the Fruit Fly’s Neural Circuit
[ Poster] [
 Thesis]
Hrvoje Ribičić, Jürgen Waser, Raphael Fuchs, Günter Blöschl, Eduard Gröller
Visual analysis and steering of flooding simulations
IEEE Transaction on Visualization and Computer Graphics, PP(99), 2012.
Jürgen Waser, Hrvoje Ribičić, Raphael Fuchs, Christian Hirsch, Benjamin Schindler, Günter Blöschl, Eduard Gröller
Nodes on Ropes: A Comprehensive Data and Control Flow for Steering Ensemble Simulations
IEEE Transactions on Visualization and Computer Graphics, 17(12):1872-1881, December 2011. [ Paper]
Bilal Alsallakh, Eduard Gröller, Silvia Miksch, Martin Suntinger
Contingency Wheel: Visual Analysis of Large Contingency Tables,
31. May 2011, International Workshop on Visual Analytics (2011), Bergen, Norway
[ Paper]
Peter Sikachev
ProtoVis,
11. May 2011, Software Seminar, Vienna
[![]() presentation]
presentation]
Harald Piringer
Large Data Scalability in Interactive Visual Analysis
Supervisor: Eduard Gröller
Duration: October 2008 — May 2011
[ Thesis]
Jürgen Waser
Visual Steering to Support Decision Making in Visdom
Supervisor: Eduard Gröller
Duration: October 2008 — June 2011
[ Thesis]
Pushpak Karnik, Stefan Jeschke, David Cline, Anshuman Razdan, E. Wentz, Peter Wonka
A Shape Grammar for Developing Glyph-based Visualizations
Computer Graphics Forum, 28(8):2176-2188, 2009. [ paper]
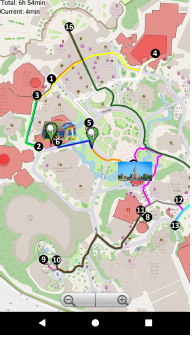
Thomas Köppel
PolicyMap: A Dynamic Map for Line-Up Policy in Amusement Parks