Overview
Satellite data comes in the form of a Two-Line Element (TLE) set (Figure 1), a format that describe a satellite's orbital elements. TLE can be used to find a satellite's position in space, but it is highly non-human-readable. Additionally, this data (provided by, e.g., SSCWeb and Space-Track.org) is provided in large numbers (approximately 17.000 satellites).
For that reason, current satellite visualization applications struggle to provide effective exploration tools. Real-Time Interactive Satellite Tracker (RTIST) is a tool for the exploration of earth's satellites. Using techniques such as brushing, dynamic queries and details on demand, this application enables users to visualize only the satellites they are interested in.
"OBJECT_NAME": "VANGUARD 1",
"OBJECT_TYPE": "PAYLOAD",
"TLE_LINE1": "1 5U 58002B 19159.78599251 -.00000069 +00000-0 -68986-4 0 9999",
"TLE_LINE2": "2 5 034.2454 302.3058 1842200 106.4760 274.5392 10.84762920164564"
Features
The features of RTIST are all implemented with visualization principles in mind, aiming to accelerate and facilitate the user's insight gaining process. In the following sections, these features are presented.
Real time tracking
In order to deliver a reasonably accurate visualization of satellites and, at the same time, smooth the user's interactions (crucial for exploration applications), RTIST periodically calculates every satellite's position and velocity using the TLE data. As this task uses expensive calculations, this is done "only" twice a second. For the time between, the satellite's velocity is used to estimate its position every frame.
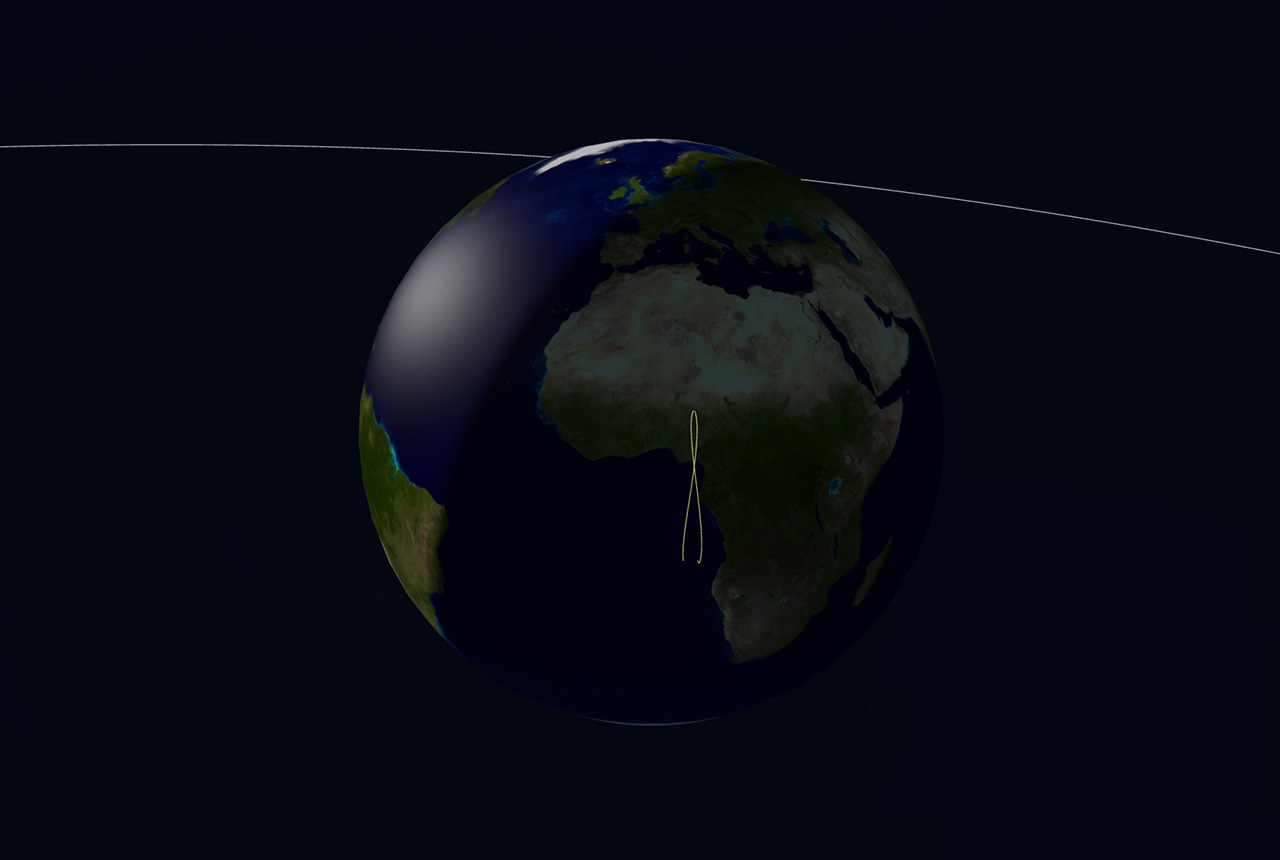
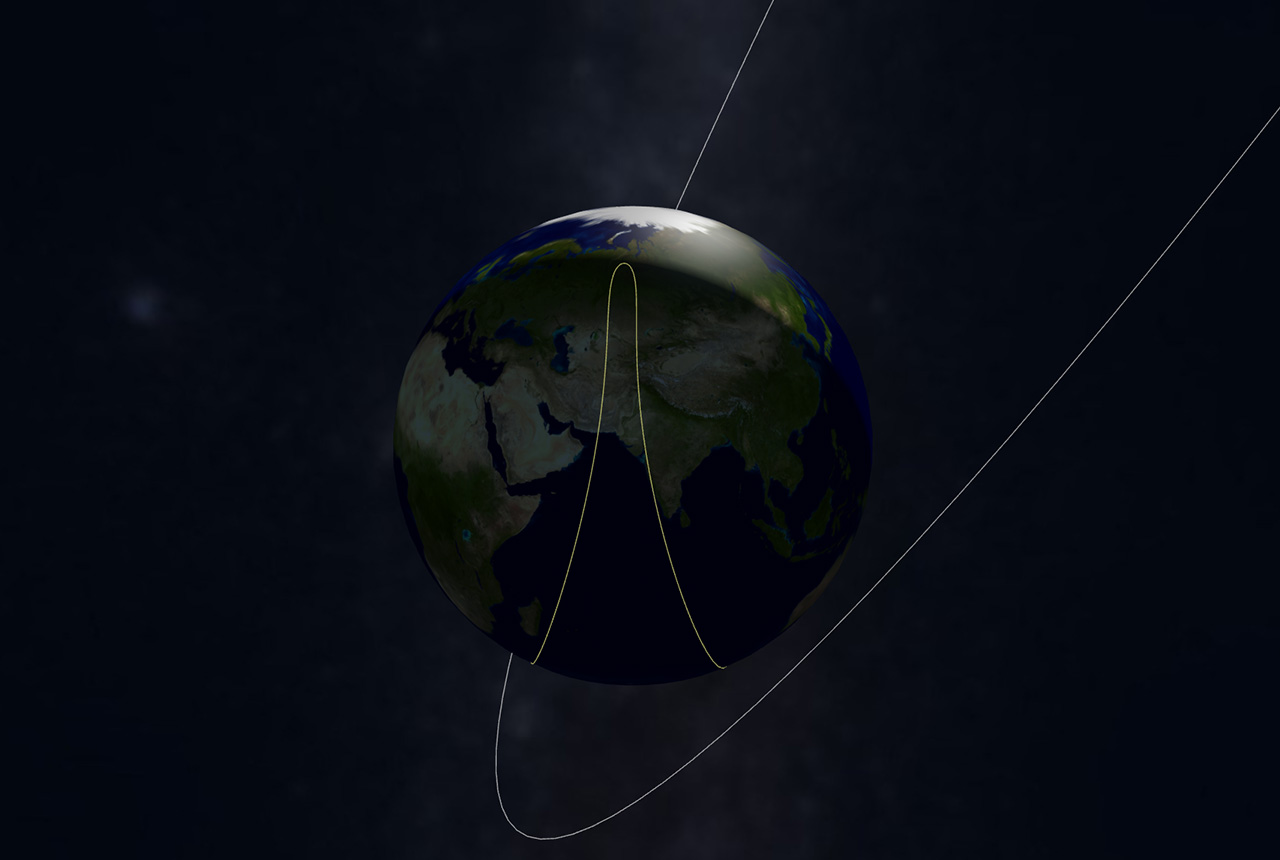
Ground track visualization
The ground track of the satellite is the projected (future) position of the satellite onto the surface of the earth. For this, the rotational speed using the sidereal time has to be taken into account, as the earth rotated below the satellite. In general two geocentric coordinate systems ECF and ECI are used. ECF does not include the rotation of earth, it is therefore fixed relative to other objects in the solar system. The ECI coordinate system on the other hand is fixed to the location on the ground and therefore rotates together with earths rotation. Example ground tracks can be seen in Figure 2.
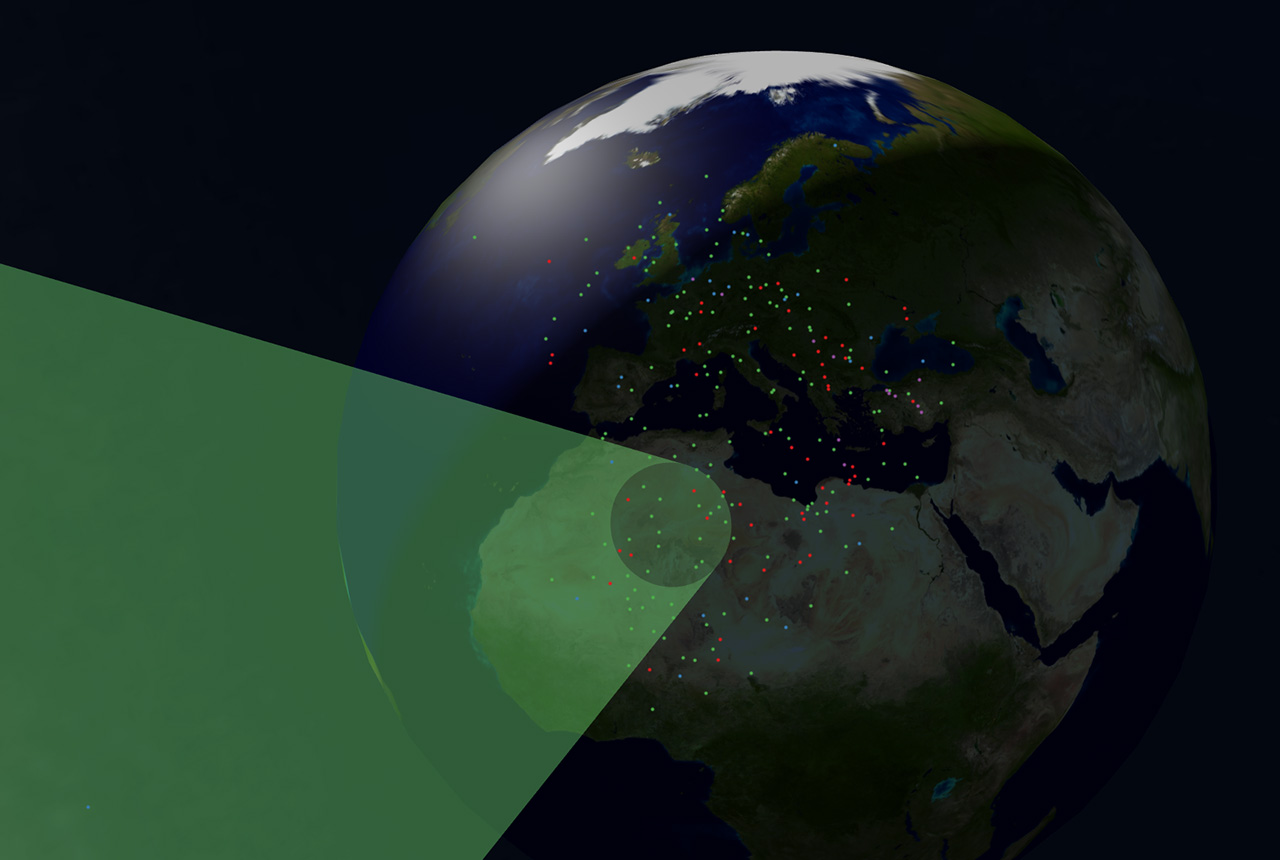
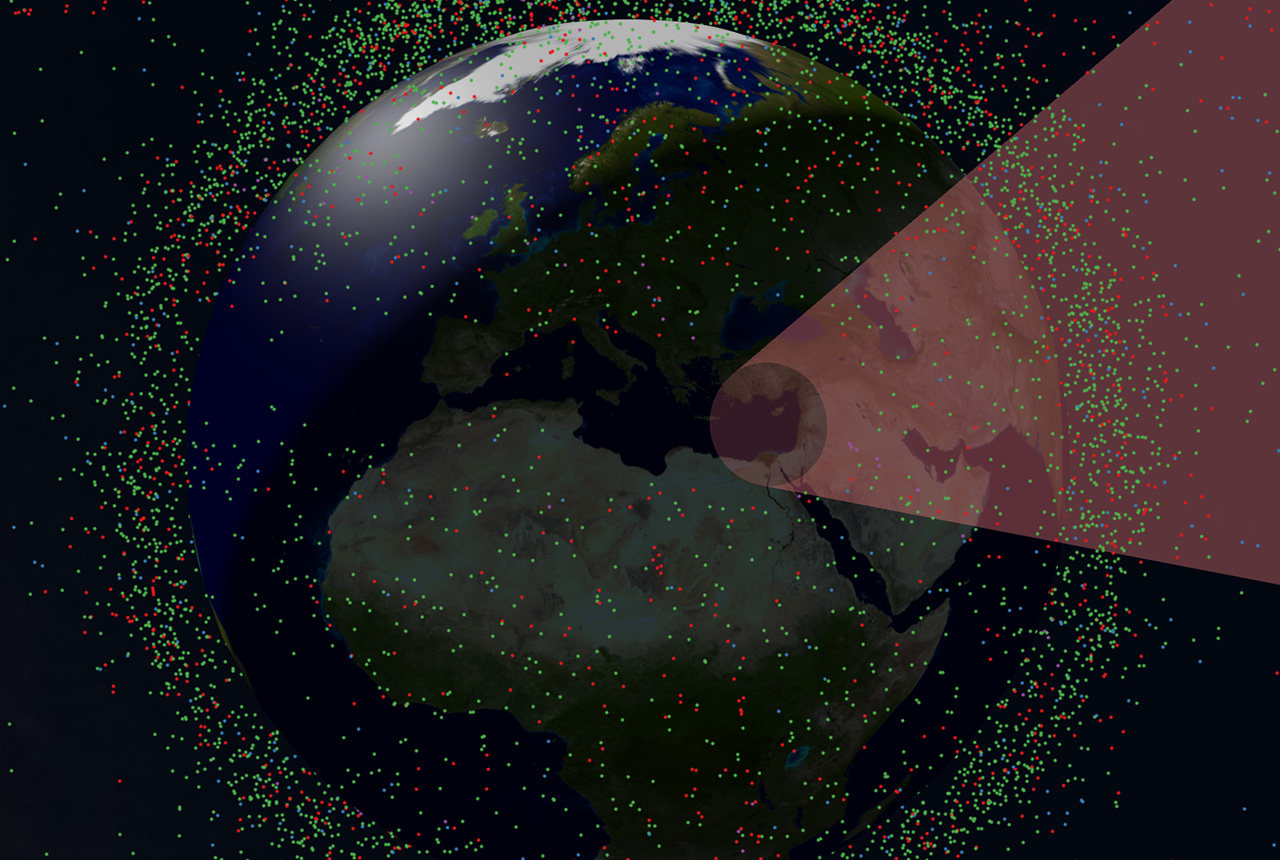
Brushing
The implemented brushing tool enables the user to select a point the earth's surface, from which the satellites in a given radius are selected. This selection is visualized in the form of a cone, as shown in Figure 3. With this tool, users can brush over a region on earth (e.g., countries or continents) and find all satellites currently over the defined area.
Details on demand
A TLE set provides information about a satellite's position at a given point in time, but it also provides multiple other values, such as inclination, eccentricity, apogee, etc. These details can be of interest to some exploration cases, but cannot be display at once for each of the (over) 17.000 satellites. For those reasons, RTIST provides these details only for a specified set of satellites. By clicking on a 3D point or on the name of a satellite on a search result, all details about that satellite are displayed in a list.
Search
Simply plotting tridimensional points around the earth and providing details on demand is not enough to provide an overview of the data and enable an effective exploration: filtering the data to find specific entries is fundamental for the insight gaining process. In the RTIST tool, using a text box, the user is able to perform dynamic queries. The input text is used to search for name and type matches. Search terms must be separated by a whitespace and satellites matching terms starting with a backslash will be excluded from the result.
Color
By coloring the 3D points based on their attributes, it is possible to visually distinguish them from each other, providing further insights. In RTIST, satellites can be colored based on their type (categorical), altitude (numerical, distance from the surface of the earth) and distance (numerical, distance from the center of the earth). The colors for the different classes were selected from ColorBrewer, a tool for guidance in using color schemes, based on the research of Dr. Cynthia Brewer. Two selection are shown in Figure 4: type (left) and distance (right).

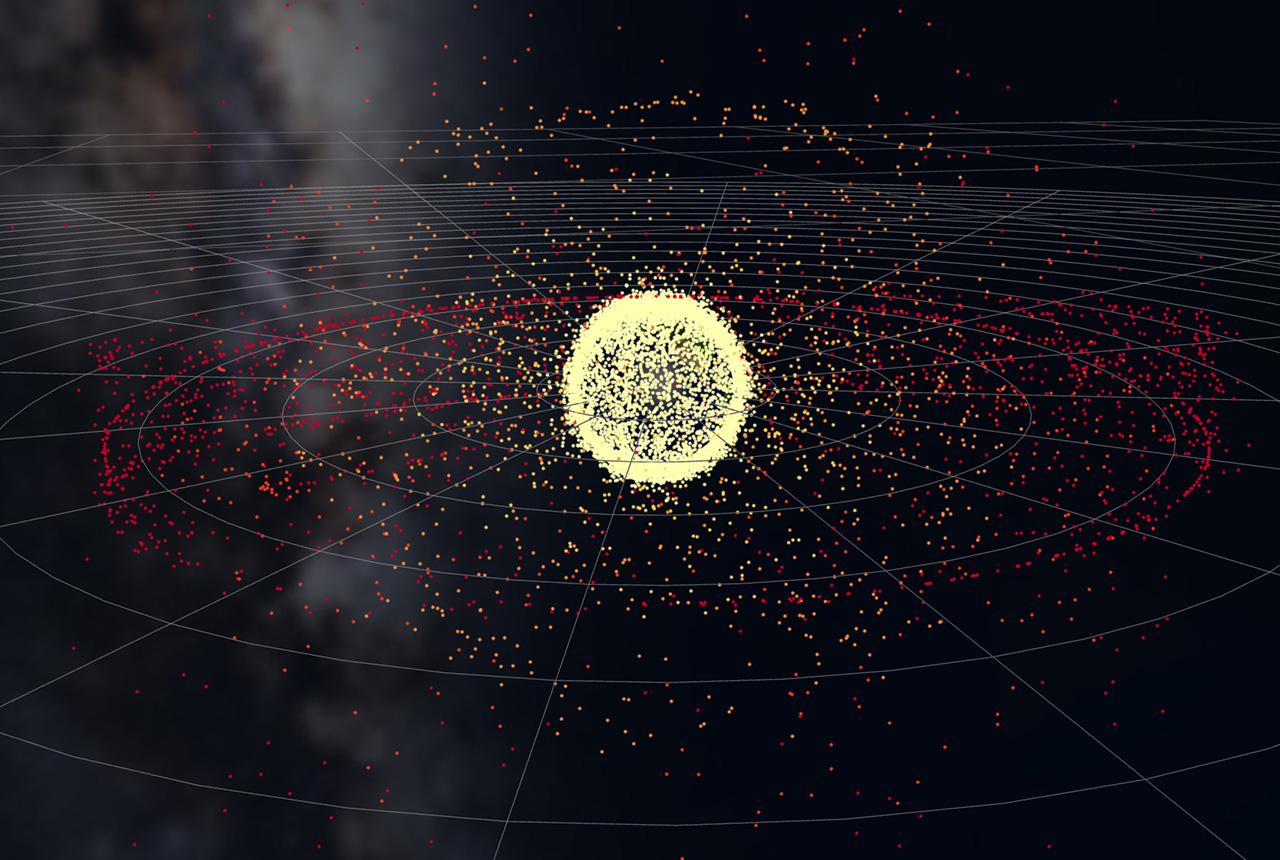
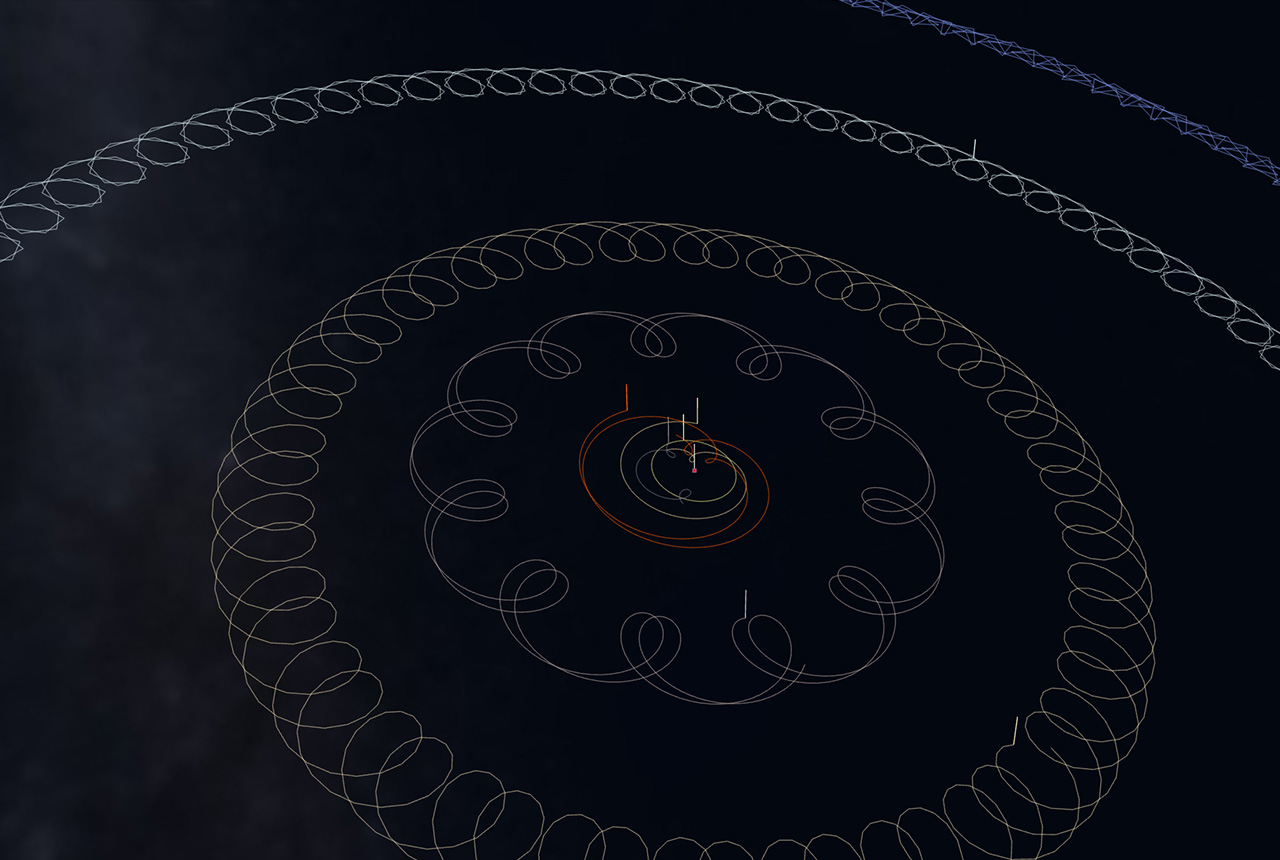
Planets
We also visualized the planets as well as the sun and the moon using the geocentric coordinates of their orbits. Additionally, as we view the earth in the celestial plane, the planets had to be transformed from the ecliptic plane using earths tilt angle. As can be seen in Figure 5, the resulting patterns look like flowers.