This program is a implementation similar to the paper "Visual exploration of relationships between document clusters" by Jusify et al.
In this paper Jusuify et al. present a novel visualization technique for multivariate networks. To visualize multiple dimensions on a 2D screen, they first perfom a clsutering.
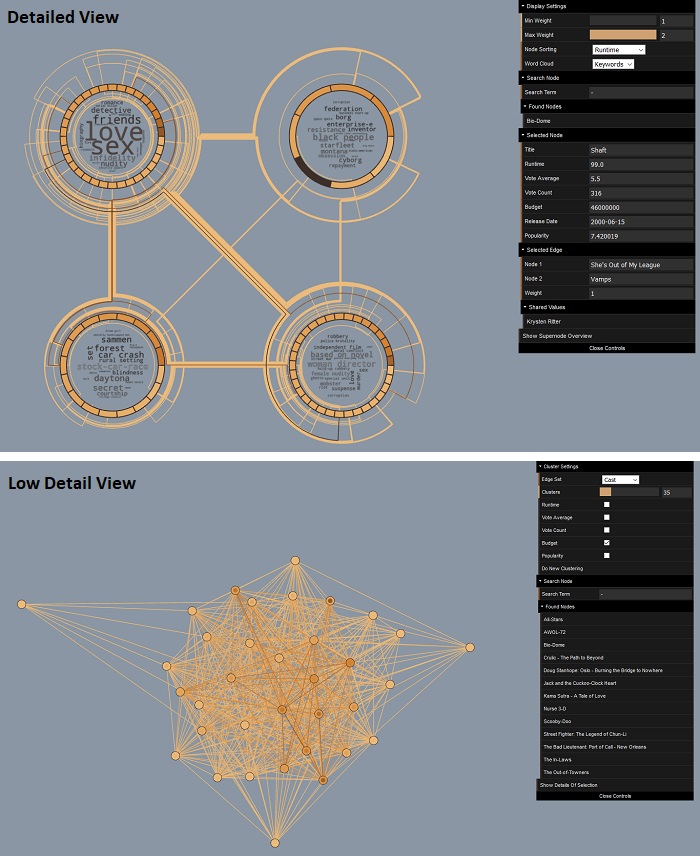
Each cluster is then visualized as a ring, with each element of the cluster beeing a ring-segment. The segments are sorted by a user-chosen feature.
Segments inside one cluster or also in different clusters that have common attributes are connected with edges. Inside of each ring there is also a word-cloud presenting even another feature.
Tooltips, edge and node selection and a settings menu provide a number of interaction possibilities for the user.
In our implementation we visualized a dataset consisting of about 900 movies and their metatdata like runtime, budget, popularity, etc..
When clustering the movies we refer to the resulting clusters as supernodes, or in other words a supernodes contains the movies of one cluster.
Edges between 2 movies can be either common actors, genres or keywords.
When starting the program, the first visualization shows a low detail view of the supernodes. The edge weight of the supernode edges is the sum of the edges between their nodes.
In the menu on the right side the user can select the cluster features and the number of clusters. By clicking "Do New Clustering" the settings are adopted.
By selecting up to 4 nodes and clicking "Show Details Of Selection" one can change to the detailed view.
In the detailed view one can select ring segements (single movies) and edges by clicking on them. Details about the selection are shown in the menu.
Additionally, one can change the sorting attribute for the movies inside a supernode.
To switch back to the low detail view click "Show Supernode Overview"
In both views one can scroll with the mouse wheel and drag the visualization with the left mouse buttton.
Additionally one can search for nodes by their name and change the used edge set (cast, keywords, genres) in both views.
To start the server execute "MultiGraphVis.exe" in the \bin folder.
Open a browser (we tested on Firefox) and call http://localhost:5000/index
MultiGraphVis conists of a Python FLASK server and a JavaScript frontend.
We used the following librarys:
JUSUFI, Ilir, et al. Visual exploration of relationships between document clusters. In: 2014 International Conference on Information Visualization Theory and Applications (IVAPP). IEEE, 2014. S. 195-203.
Max Sbardellati
Sebastian Haushofer