- Thomas Koch, 01526232
- Felix Kugler, 01526144
Paper Summary
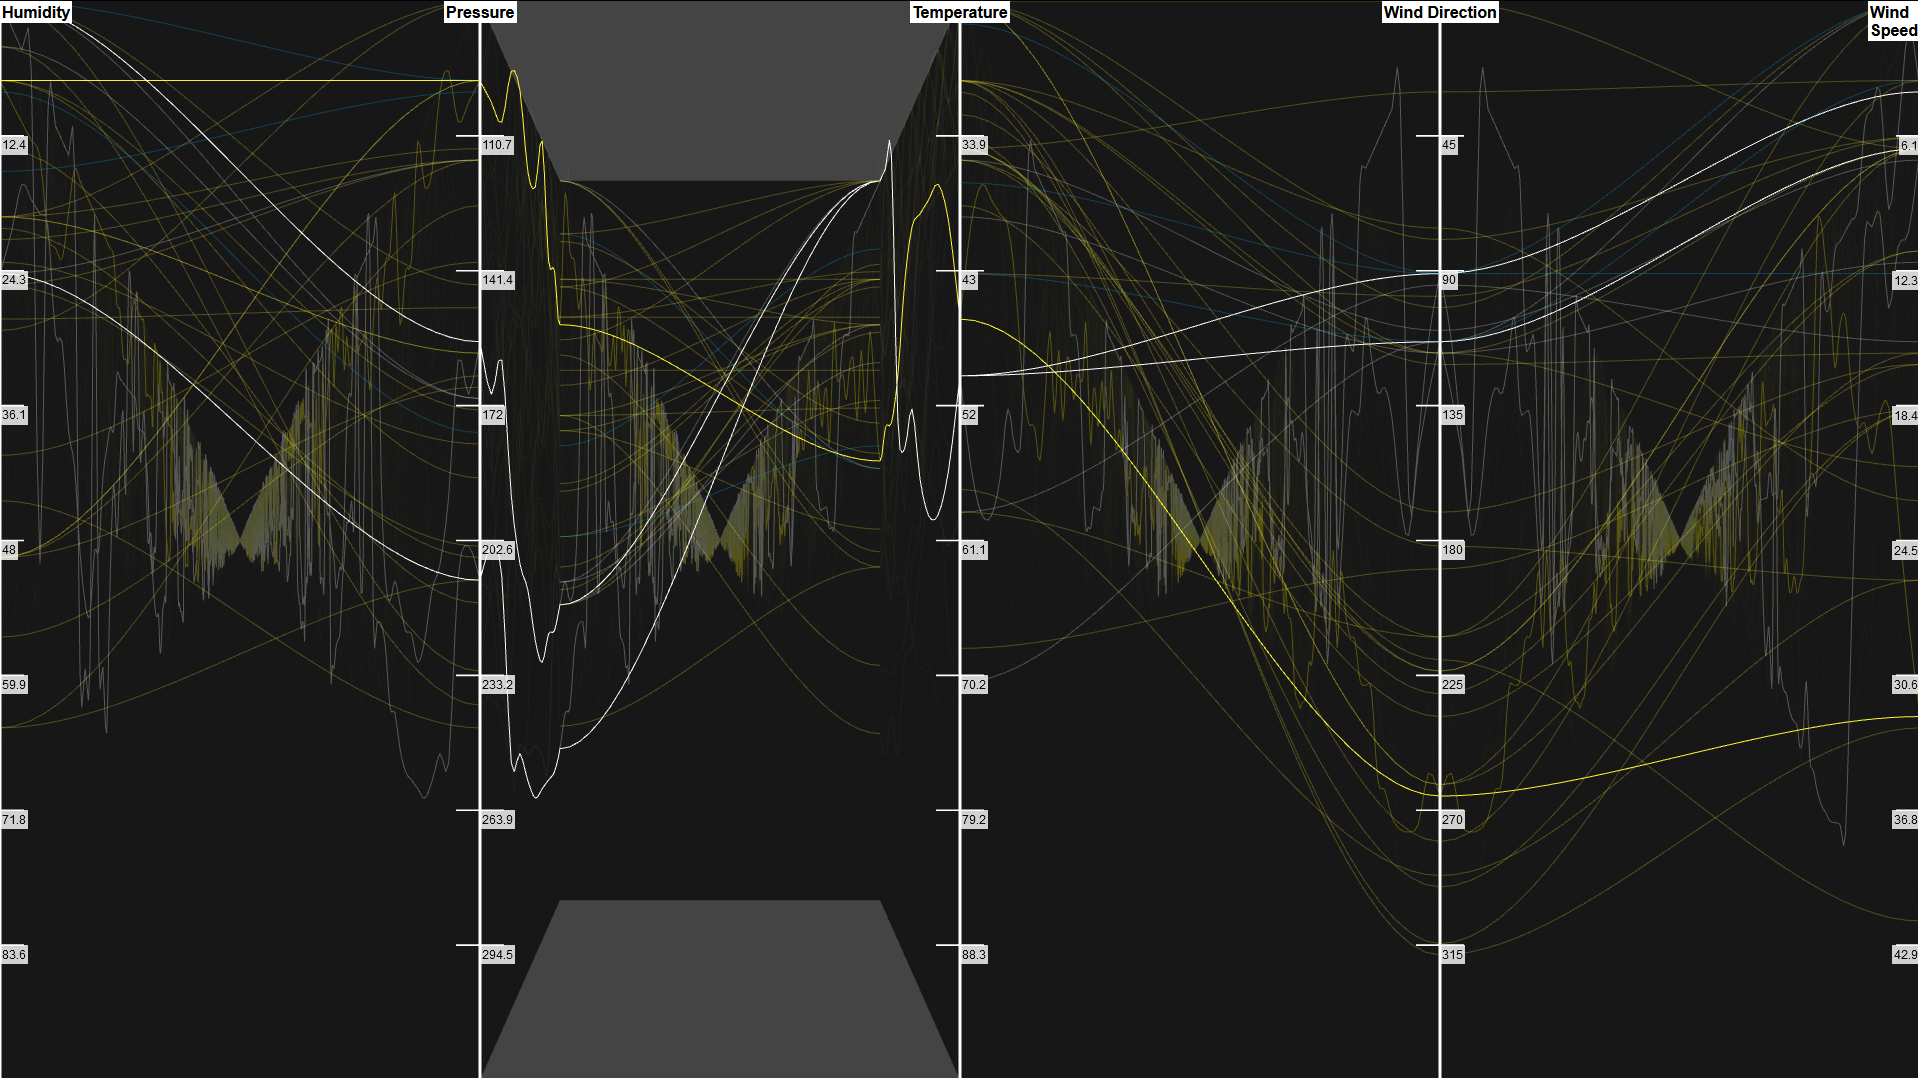
Gruendl et. al. [1] describe parallel-coordinates with integrated time-series plots. The
parallel-coordinate plot is extended along the third dimension (z-axis) which allows to
visualize time-dependent multivariate data. Each time-series plot relates to one
time-dependent attribute and is drawn on perspectively distorted rectangles which
are embedded between two axis of attributes. The time-series plot show the change
of the attribute over time for many data records. A semi-transparent panel, that
connects two time-series plots and can be moved along the z-axis, helps to explore
the relationship between two attributes over time. Typical interaction
methods used for parallel-coordinates like brushing are also possible.
Implementation
The plot is implemented (code documentation)
using JavaScript and three.js [2]
(script.js,
index.html).
The data is preprocessed using a Python script
(prepare.py) and stored
in a file vertices.vbo.
The lines of the
parallel-coordinates plot are drawn using cubic bezier curves while
spline curves are used for the time series plots. Due to limitations of
WebGL the linewidth parameter is ignored on most platformes [3].
Data
Historical hourly weather data for the year 2017 of three Canadian
(blue), six Israeli (white) and 29 US cities (yellow). Five different
attributes are measured and visualized: Humidity, pressure, temperature,
wind direction and wind speed.
Controls
-
Axis reordering: Click an axis label (humidity, pressure,
temperature, wind direction, wind speed) and drag horizontally.
-
Brushing: Click an axis (white vertical lines) and drag
vertically.
-
Move PC plot along time dimension: Click the space
between two axis and drag vertically.
References
- Gruendl, Henning, et al. "Time-Series Plots Integrated in Parallel-Coordinates Displays." Computer Graphics Forum. Vol. 35. No. 3. 2016.
- https://threejs.org/
- https://www.kaggle.com/selfishgene/historical-hourly-weather-data
- https://threejs.org/docs/#api/en/materials/LineBasicMaterial.linewidth