This program is an implementation of the paper "Radial Sets: Interactive Visual Analysis of Large Overlapping Sets" by Bilal Alsallakh, Wolfgang Aigner, Silvia Miksch, and Helwig Hauser.
The Radial Set presented in Alsallakh et al. is a frequency and aggregation based method to visualize large overlapping sets and it improves readability and scalability compared to other set visualizations. Radial sets aggregate elements of each set into groups according to their degrees to grant better scalability. This produces better readability but precise comparisons and details on demand need additional interactions and visualizations.
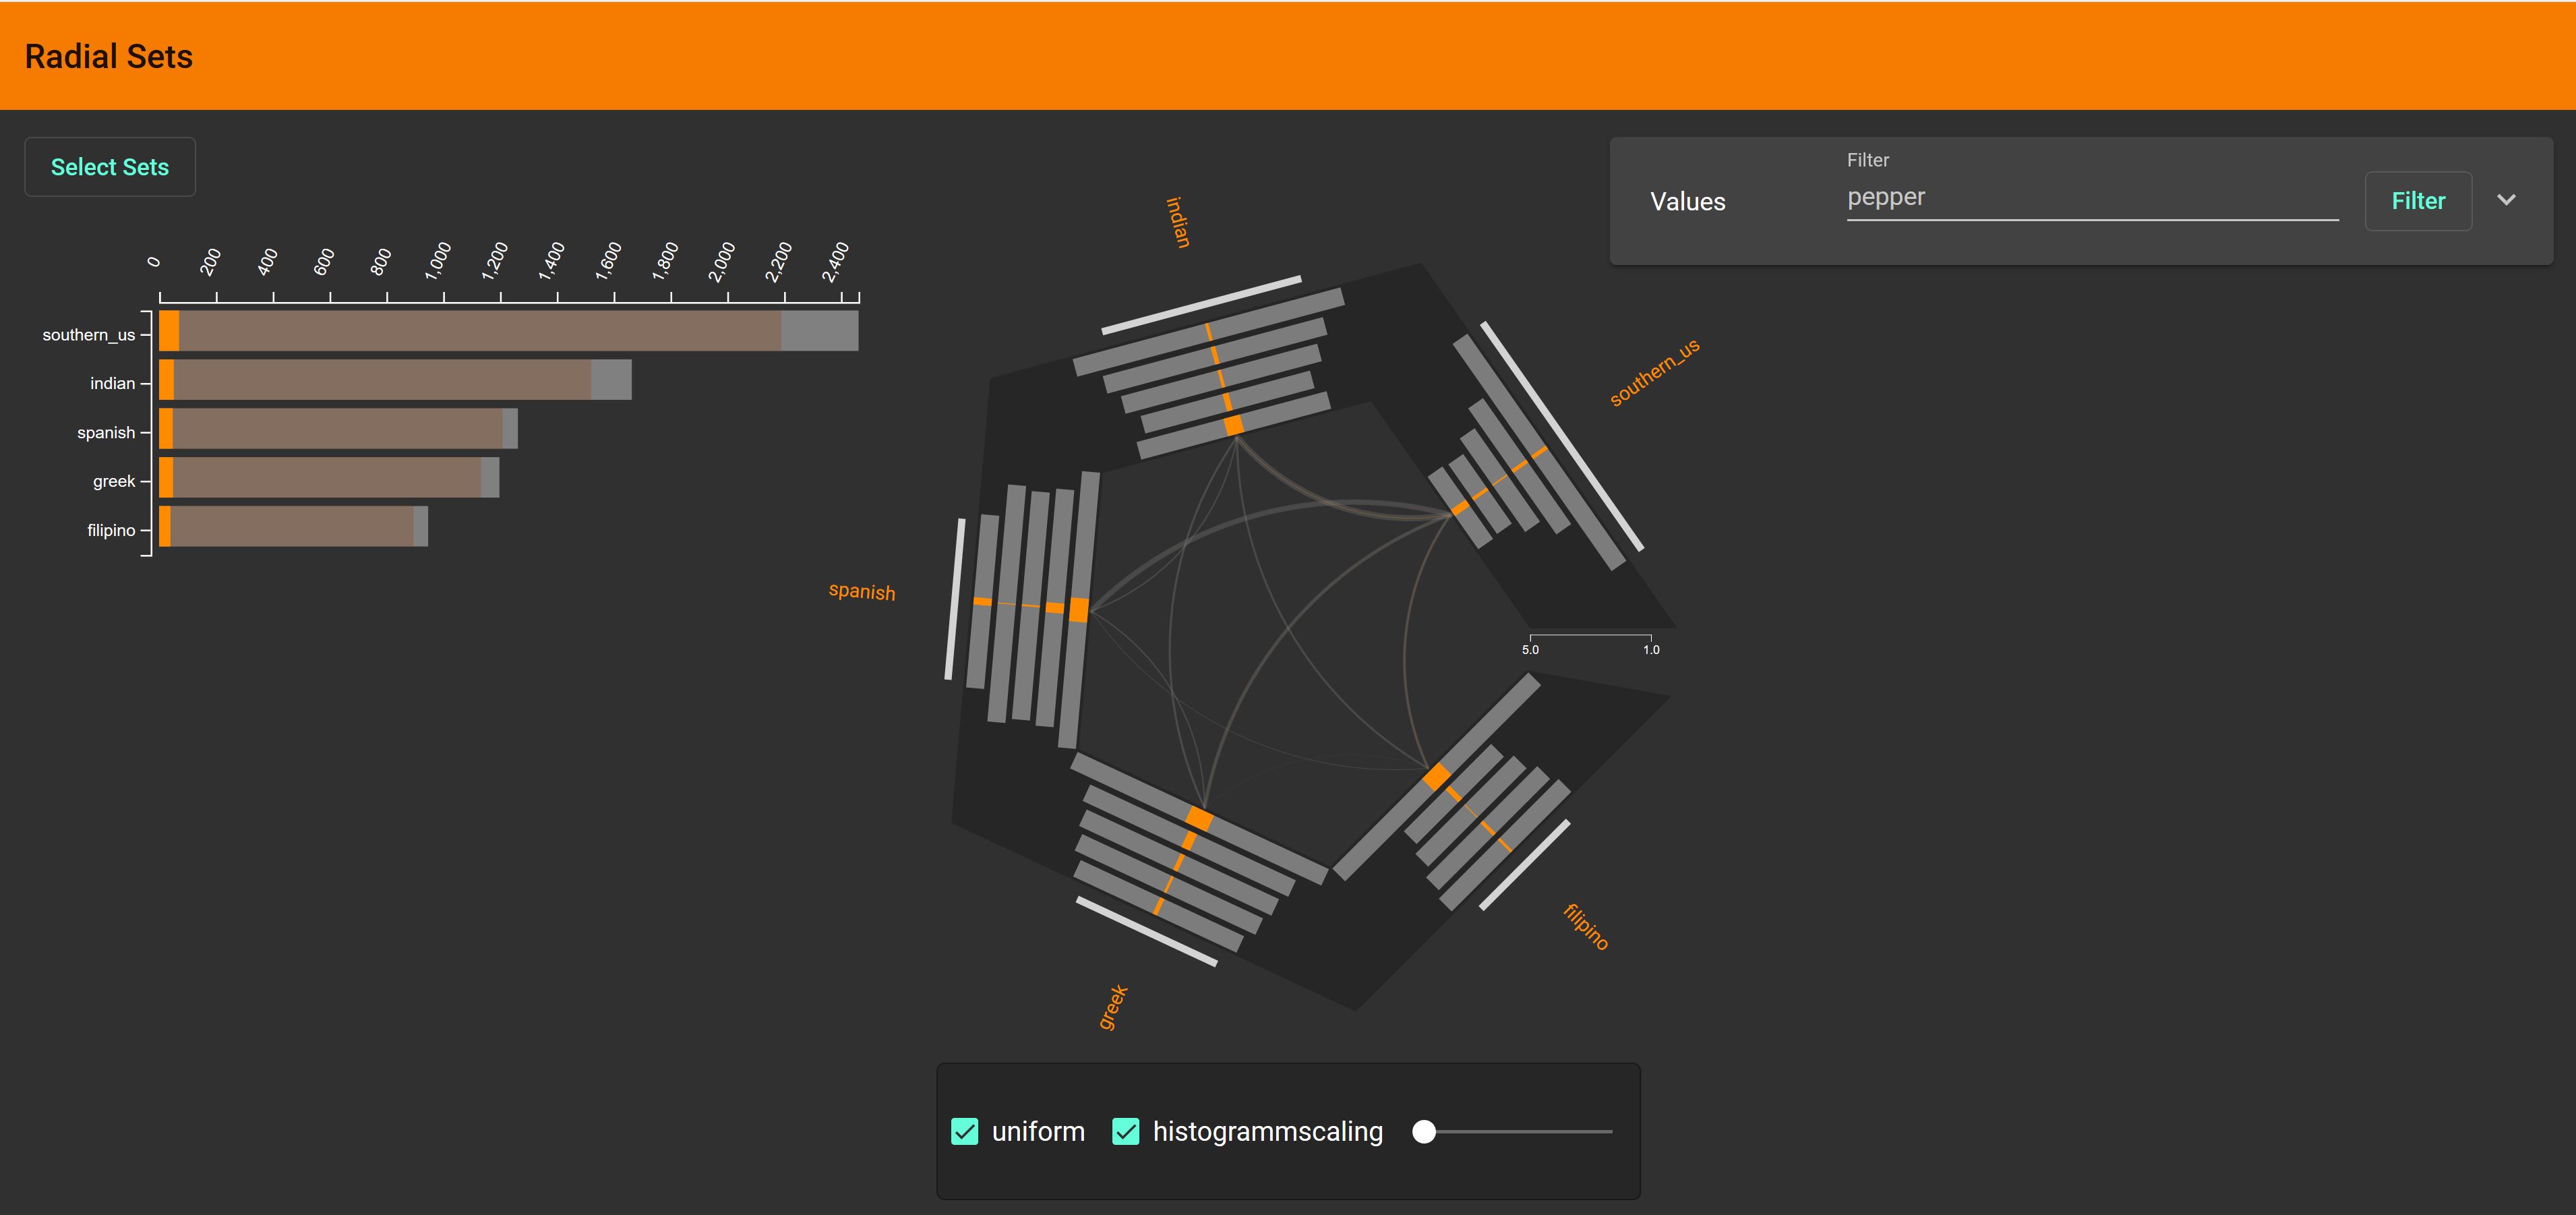
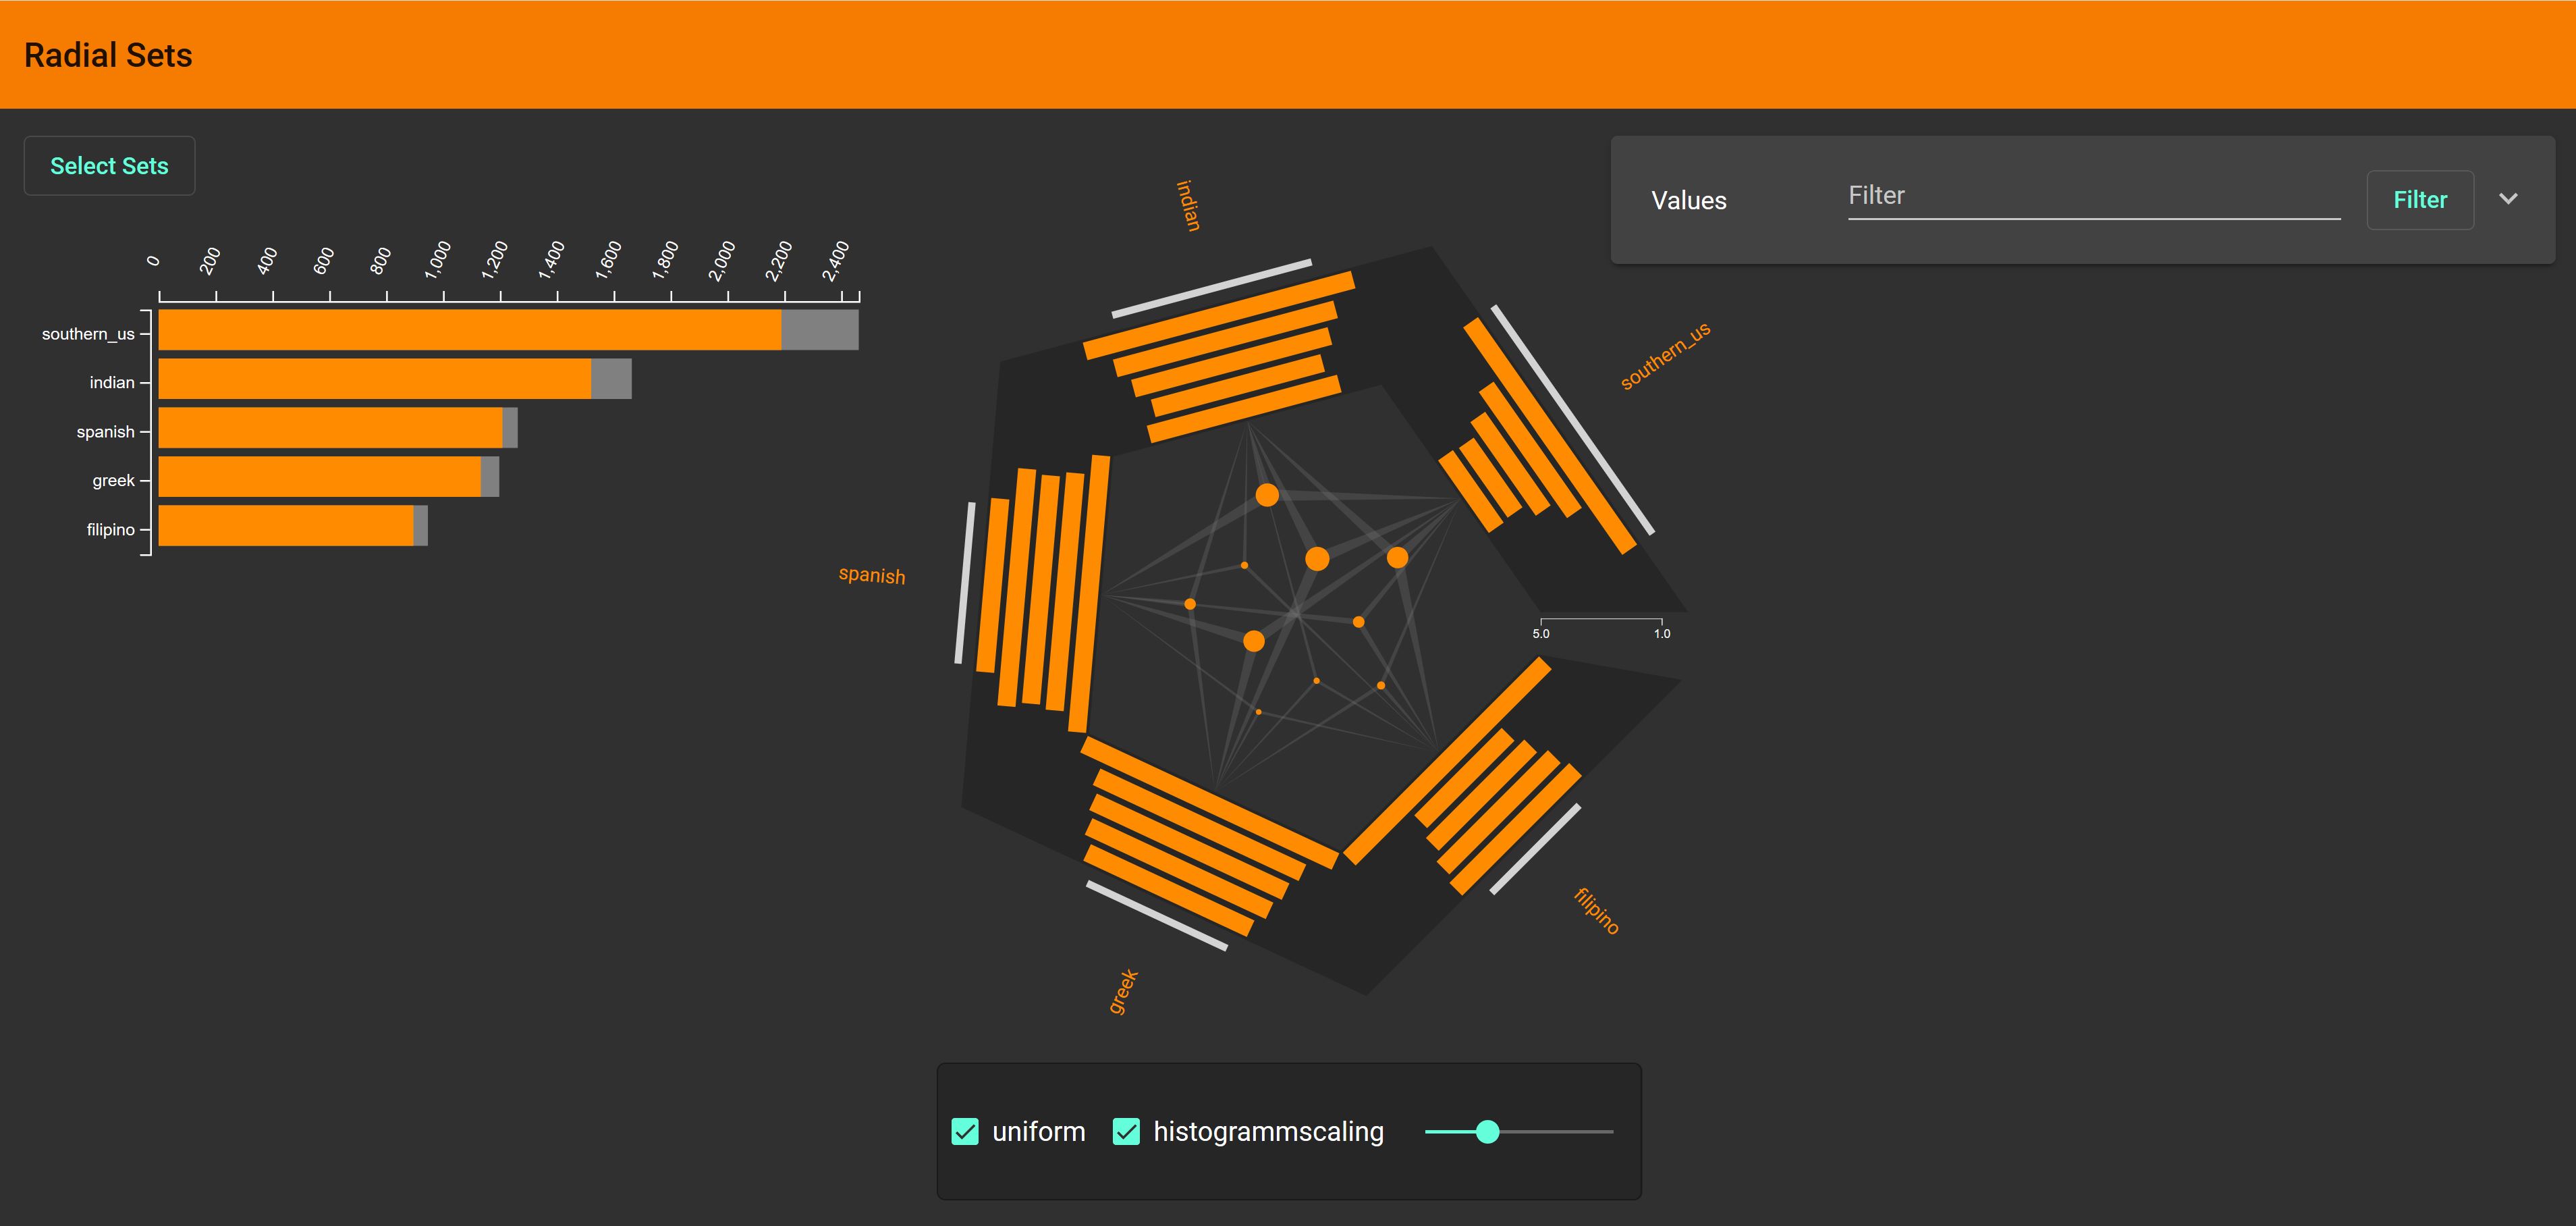
There are three important visual elements in a Radial Set:
The program is written in JavaScript and uses the D3 library for the data visualisation.
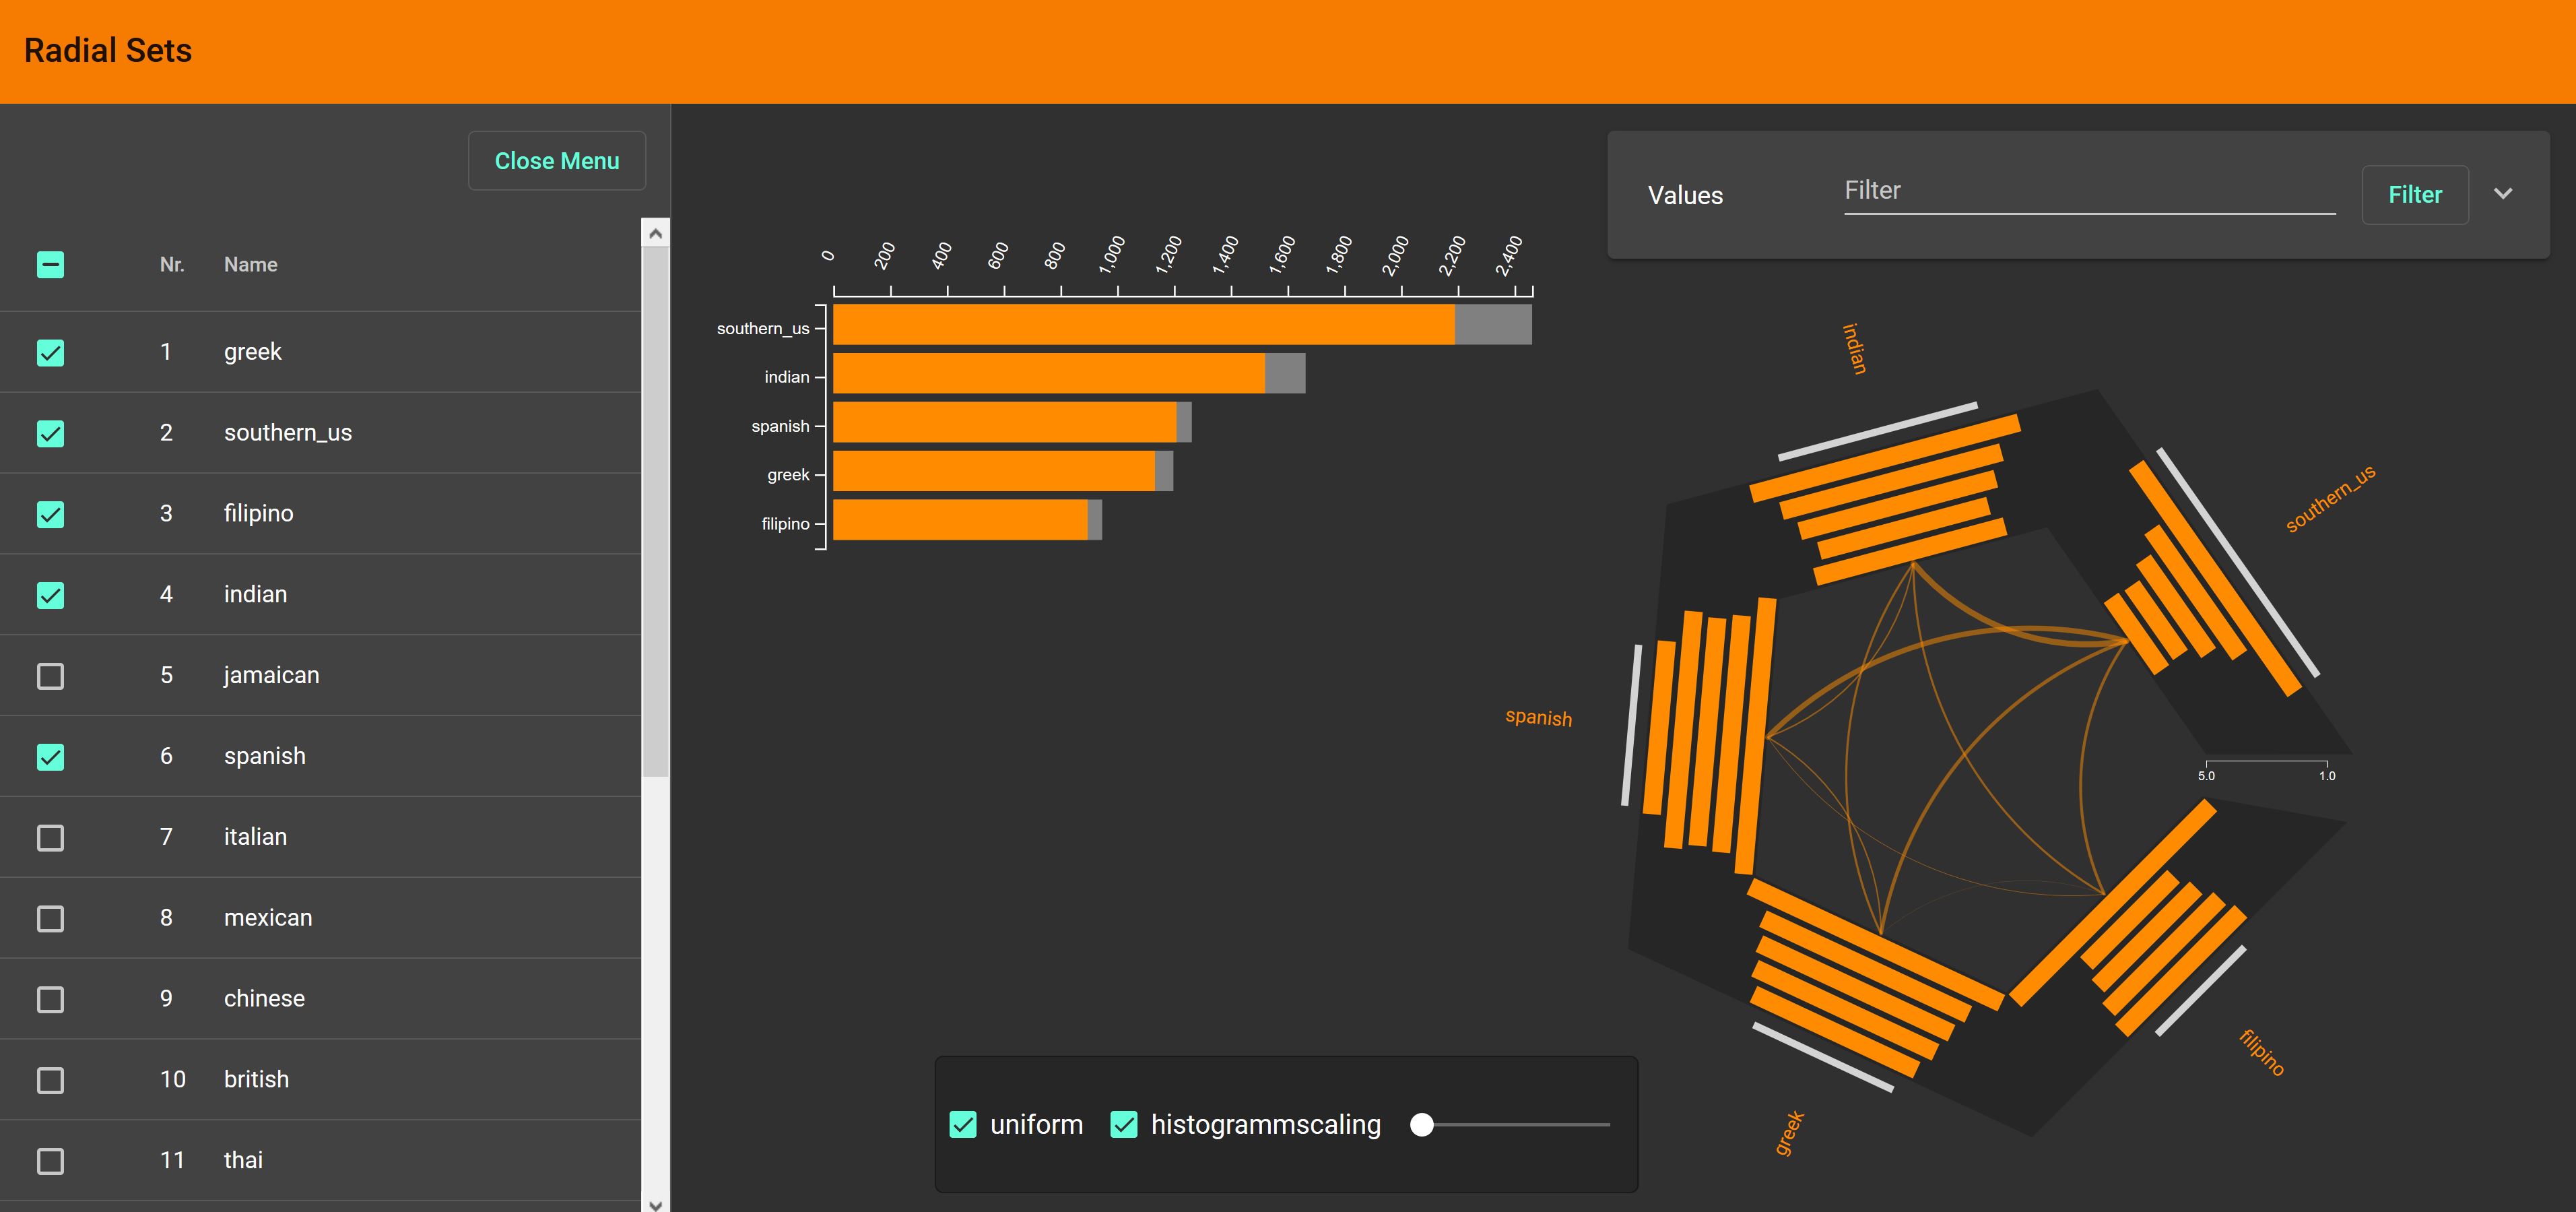
In the sidebar on the left, the user can select sets that should be visualised in the Radial Set.
The Radial Set can be viewed both uniformly and non-uniformly to provide more options to compare the different sets. The user can click on the histogram-bars, arcs and hyperedges to get a detailed view of the contained values.
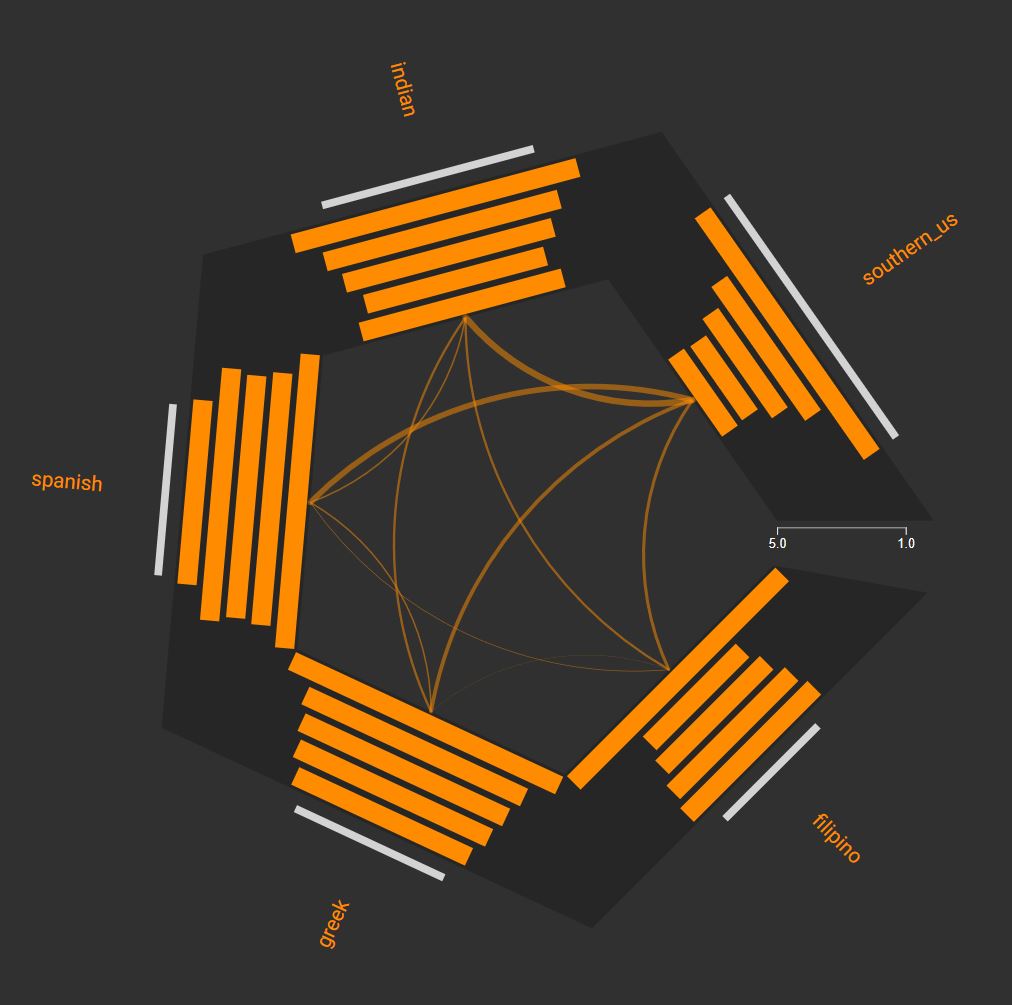
It is also possible to search for certain values. All values, that contain the input string will be highlighted orange and can be viewed as a list.
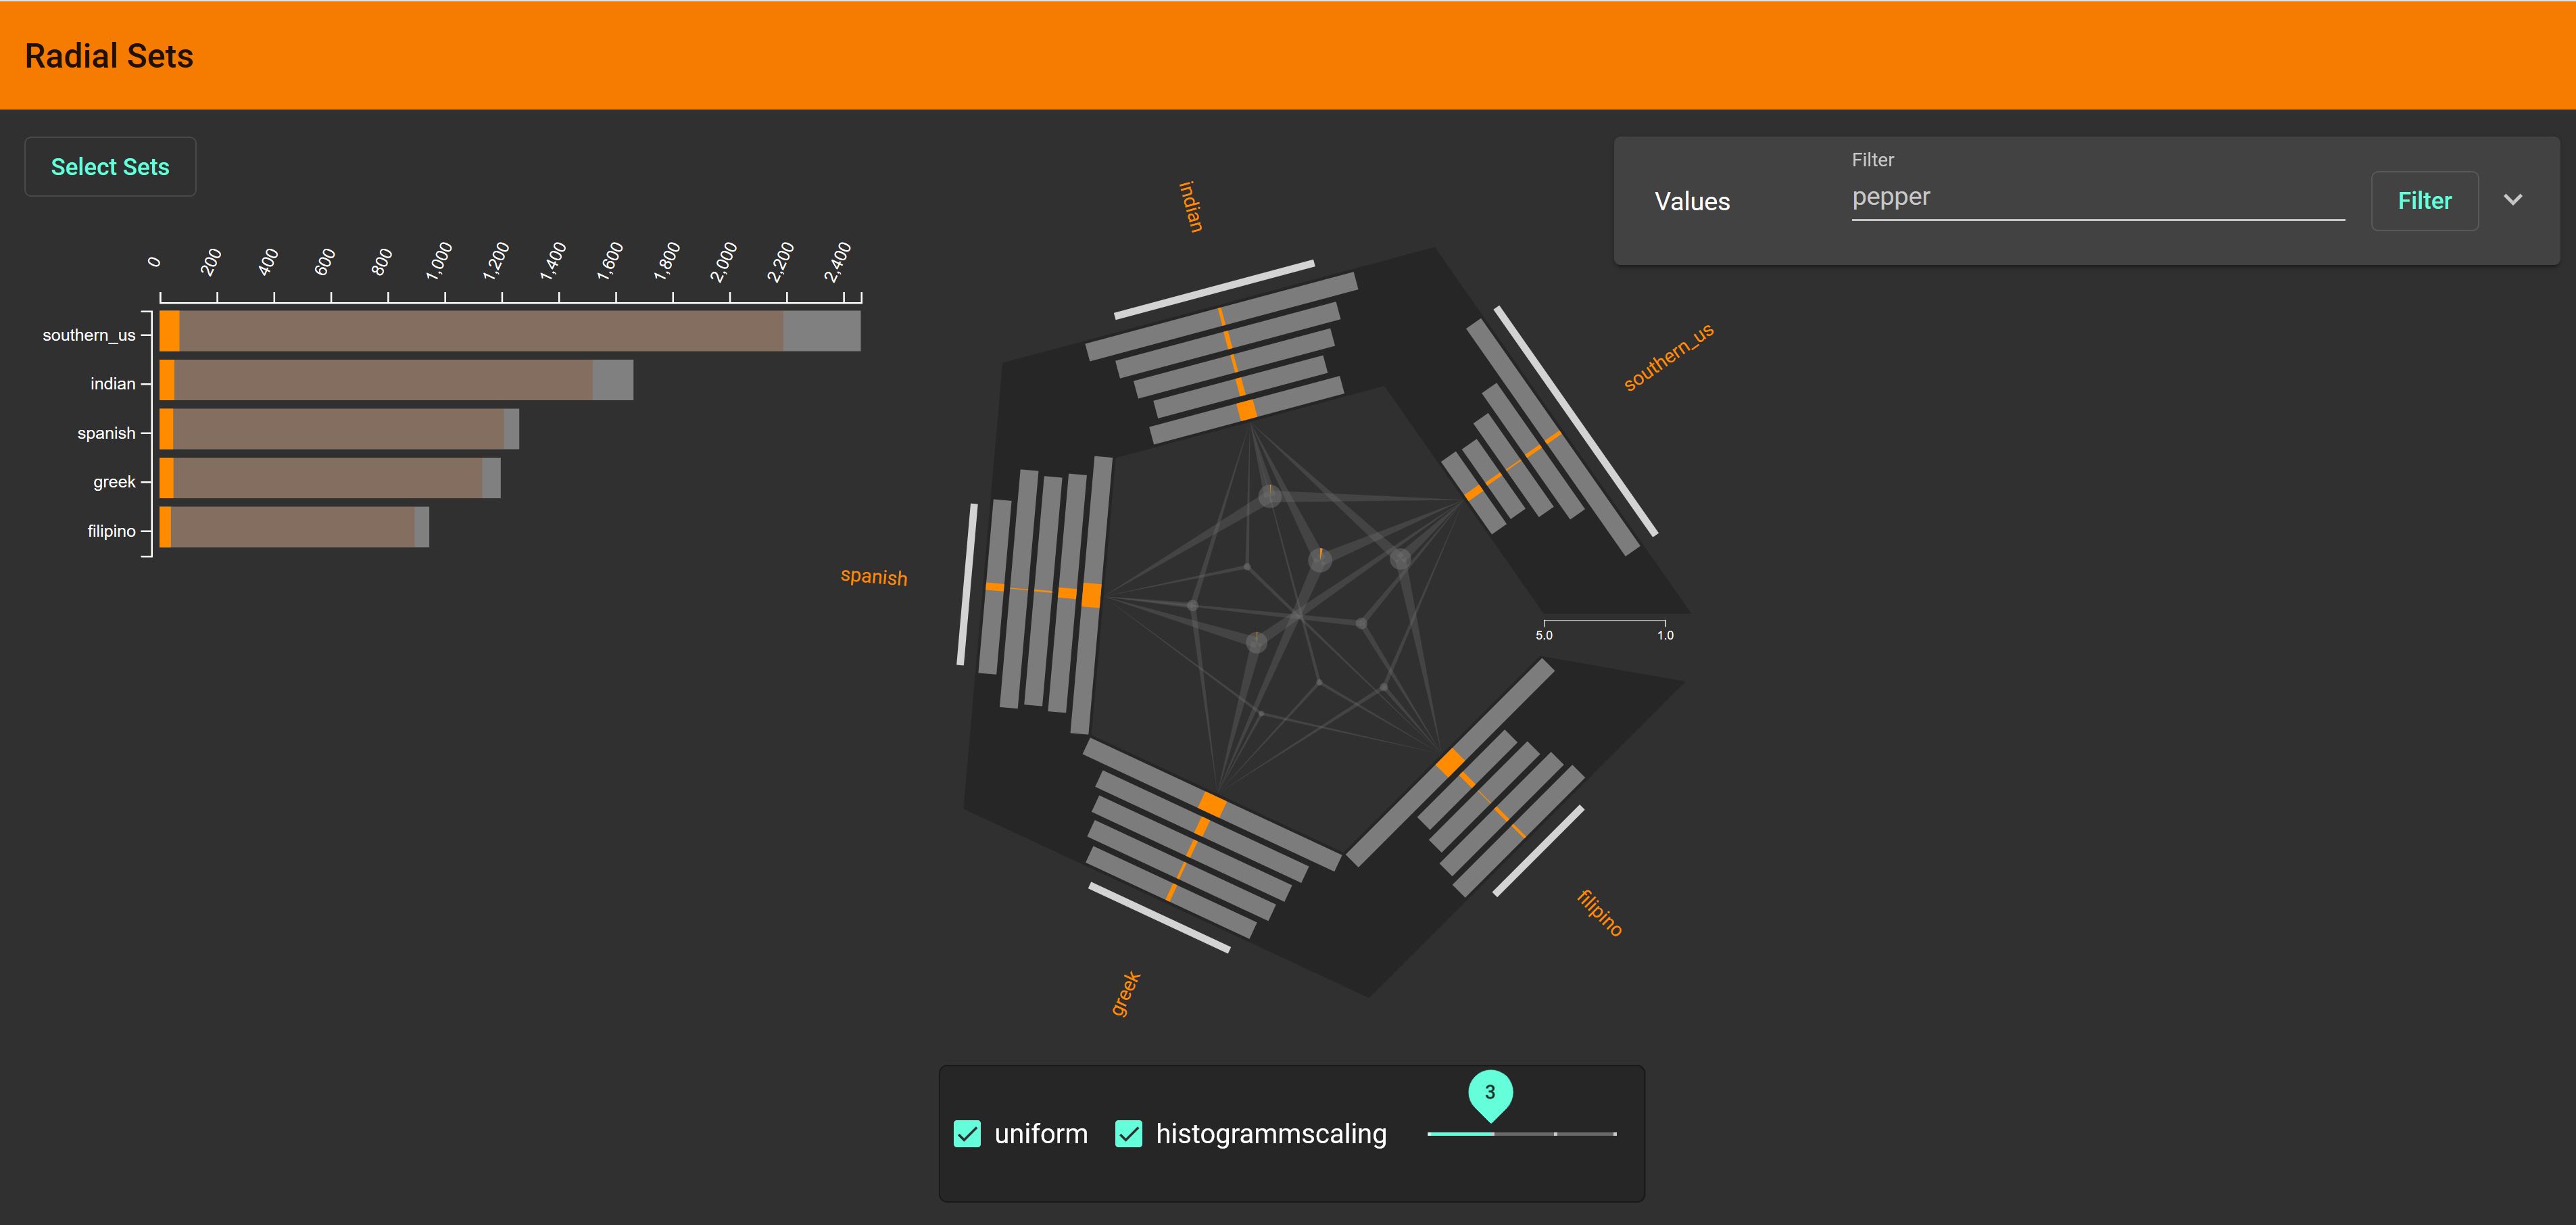
The Radial Set visualises only one degree of overlaps at a time. The degree can be selected by a slide bar. Overlaps of degree 2 are visualised as arcs and hyperedges are used for overlaps with degree >= 3.
The ‘Recipe Ingredients Dataset’ was provided by Yummly and contains various cuisines and ingredients. Every cuisine, while sharing many common elements with others, uses a handful of unique ingredients. Salt, for example, is a very commonly ingredient while oreos are only listed in the british, irish and southern_us cuisines.
The second dataset is the 'IMDB data from 2006 to 2016' where we used the genres as sets and actors as values.
Visualisation by Wolfgang Rumpler and Anna Sebernegg.